Fig. 3.
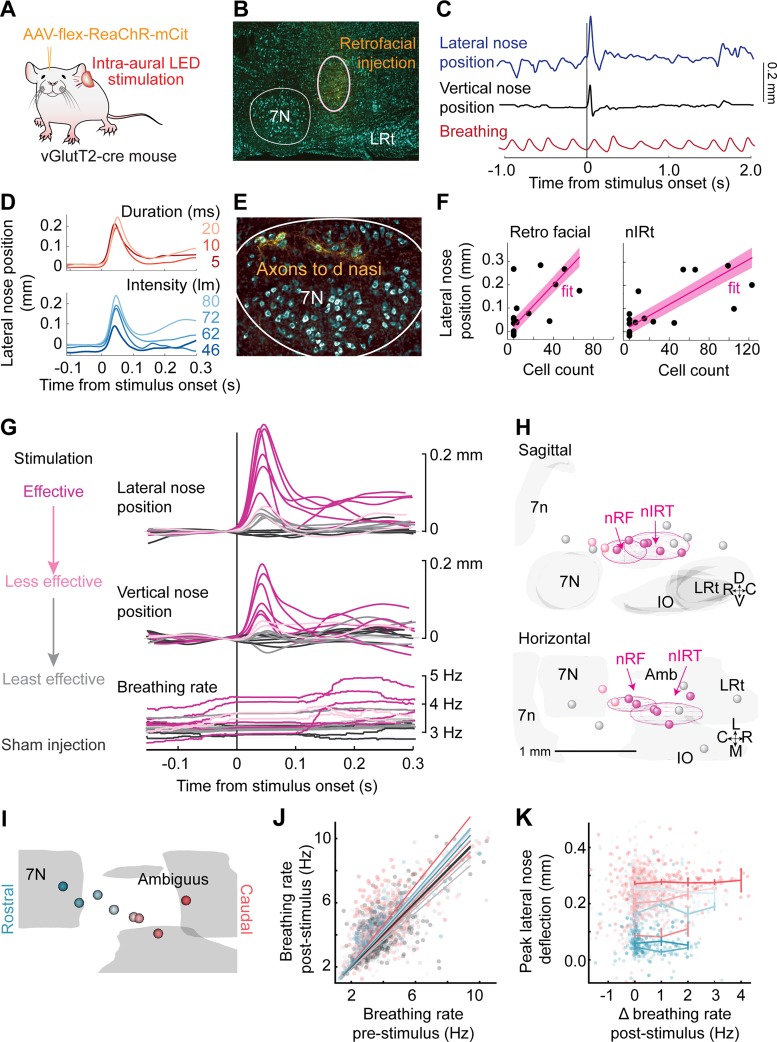
Optogenetic stimulation in nose retrofacial (nRF) and nose intermediate reticular (nIRt) areas evoke nose movement. A: diagram of the experimental setup. Transgenic mice were injected with an AAV virus (AAV-flex-ReaChR-mCit) to drive expression of red-shifted channelrhodopsin (ReaChR) in glutamatergic cells at the injection site. Nose movement was monitored by high-speed video in head-fixed mice, while breathing was monitored with a thermistor implanted in the nasal cavity. Stimulation was done by ReaChR stimulation with an LED through the ear canal. B: example histological identification of an injection site in the nRF area. Cell bodies were stained with NeuroTrace blue (cyan) and monomeric citrine (mCit)-labeled cells in yellow. C: example trace of lateral nose motion (blue), vertical nose motion (black), and breathing (red). The nose deflects laterally and upward after stimulation with a 10-ms LED pulse. Injection site is shown in B. D, top: example average lateral nose motion response to stimulation at 5 (dark red), 10 (red), and 20 ms (light red), with current adjusted such that the power remains constant across parameters. Bottom, example average lateral nose motion response to stimulation with 10-ms pulses at stimulation values of 46 (dark blue), 62 (medium blue), 72 (blue), and 80 lumens (light blue). E: axons (yellow) labeled in the dorsolateral facial motor nucleus after AAV-flex-ReaChR-citrine injection into the nRF area. Cell bodies were stained with NeuroTrace Blue (cyan). Injection site is shown in B. F: average lateral nose peak position after stimulation with a 10-ms pulse as a function of cell counts in the nRF and nIRt areas. Each point is the average from a single mouse. Linear fits are shown in magenta. G: average traces of lateral nose movement, vertical nose movement, and breathing rate after stimulus onset. Trials were selected by movement variance before stimulation onset and <0.5-Hz breathing rate change as compared before and 100 ms after stimulation onset. Effective stimulation sites (magenta), less effective stimulation sites (orange), and least effective stimulation sites (gray) are defined from the functional data. Sham injections (black) were done in Cre-negative mice. H: 3-dimensional reconstructions of ReaChR injection centroids. Sagittal (top) and horizontal (bottom) views are shown. Colors are drawn from the functional results in G. Centroids of effective stimulation sites (magenta) tend to overlap with the nRF and nIRt regions. I: color coding of all effective stimulation sites from rostral (blue) to caudal (red). J: breathing rate pre- vs. poststimulation. Stimulation of some injection sites showed a slight increase in breathing rate, but on most trials the breathing rate remained constant. K: peak lateral nose deflection as a function of change in breathing rate poststimulation. Flat profile of the graph indicates that lateral nose movement evoked by stimulation does not depend on eliciting a change (Δ) in breathing rate.

