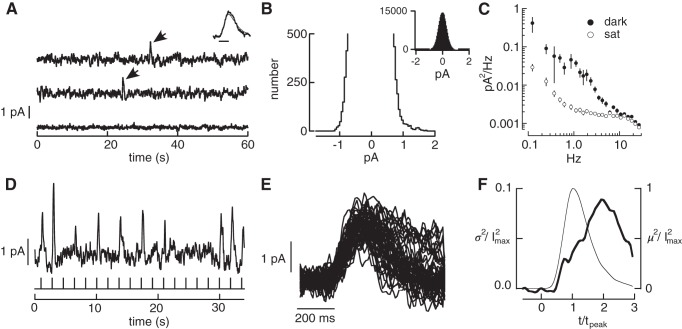
Fig. 3.
Measurements of three primary noise sources in primate rods. A: current traces from a suction electrode recording of a primate rod. The top two traces are in darkness. Each large positive current deflection (arrows) originated from spontaneous activation of rhodopsin. The bottom trace is recorded in the presence of a bright light that holds the outer segment ion channels closed, exposing the contribution of instrumental noise. Inset compares the average of 8 discrete noise events (thick trace) with the cell's average single-photon response (thin trace). Bandwidth: 0–5 Hz; scale bar 200 ms. B: expanded histogram of currents recorded in darkness. The skew in the distribution toward positive current values was used to estimate the rate of thermal activation from Eq. 6. The inset shows the full distribution. C: solid circles: power spectrum of the continuous dark noise in recording segments lacking discrete noise events. Open circles: power spectrum in the presence of saturating light. D: rod responses to a repeated dim flash (0.5 photoisomerizations on average). Bandwidth 0–5 Hz. E: isolated single-photon responses. F: change in time-dependent variance attributable to photon absorption (variance of singles minus that of failures) collected across rods. Thin line is mean squared response and thick line is the time-dependent variance. The time-to-peak and peak amplitude of the single-photon response in each rod were normalized to one before combining results across rods. Data (6 rods, 1,077 single-photon responses total) from Field and Rieke (2002a). I2max, peak response; m2, mean squared response; sat, saturating light; σ2, response variance; t, time; tpeak, time to peak.

