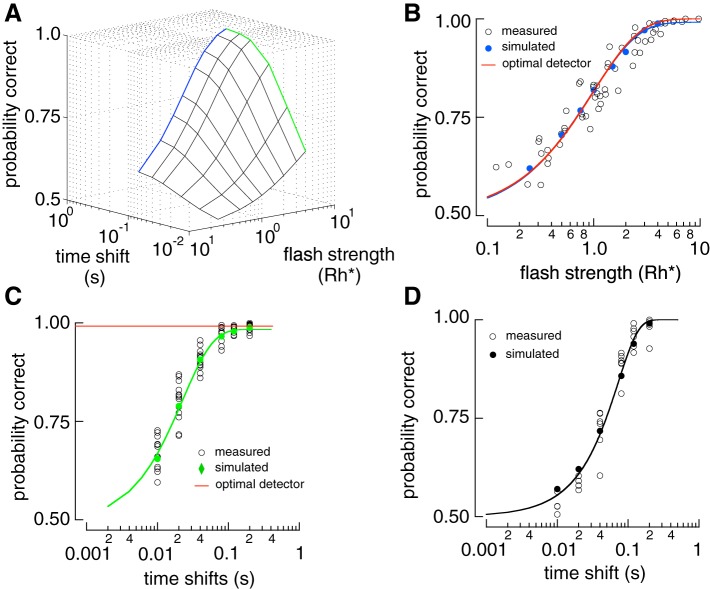
Fig. 5.
Comparison between the sensitivity of the real and simulated rod responses. A: sensitivity surface of a simulated rod in the two-alternative forced-choice (2AFC) task of Fig. 1. The blue line is the detection-limited end of the surface, and the green line is the timing-limited end of the surface. B: detection-limited slice of the surface in A. Solid circles show model performance and open circles results from individual rod data replotted from Fig. 2. Red line is performance of the ideal photon detector. C: timing-limited slice of the surface in A. D: temporal sensitivity of simulated and measured single-photon responses. Black curve is a cumulative Gaussian fit reaching 0.75 probability correct at 50 ms. Rh*, photoisomerization.

