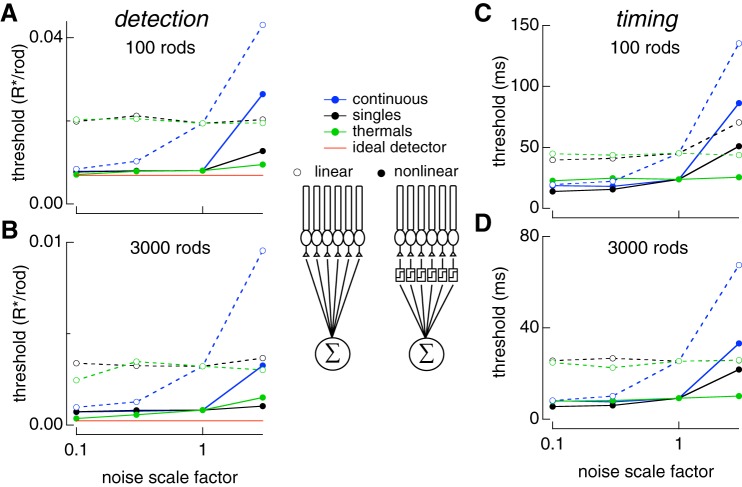
Fig. 7.
Varying sources of rod noise in pools of rods. Responses of collections of rods were simulated using Eq. 8 while varying rod noise sources as in Fig. 6. A: detection threshold for pools of 100 rods as each noise source is varied. Time offset between flashes was 200 ms (detection limited). B: same as A for pools for 3,000 rods. Results for linear pooling shown with open circles and dashed lines. Results for nonlinear pooling shown with solid circles and solid lines. C: temporal threshold for pools of 100 rods as each noise source is varied. Flash strengths were 0.1 photoisomerizations (Rh*) for linear and nonlinear pooling. These were chosen because each produced >98% correct at large time offsets so that discrimination was timing limited. D: same as C for pools of 3,000 rods. Flash strengths were 0.01 and 0.003 Rh* for linear and nonlinear pooling, respectively. Legend in middle of figure shows schematic for linear and nonlinear pooling.

