Fig. 12.

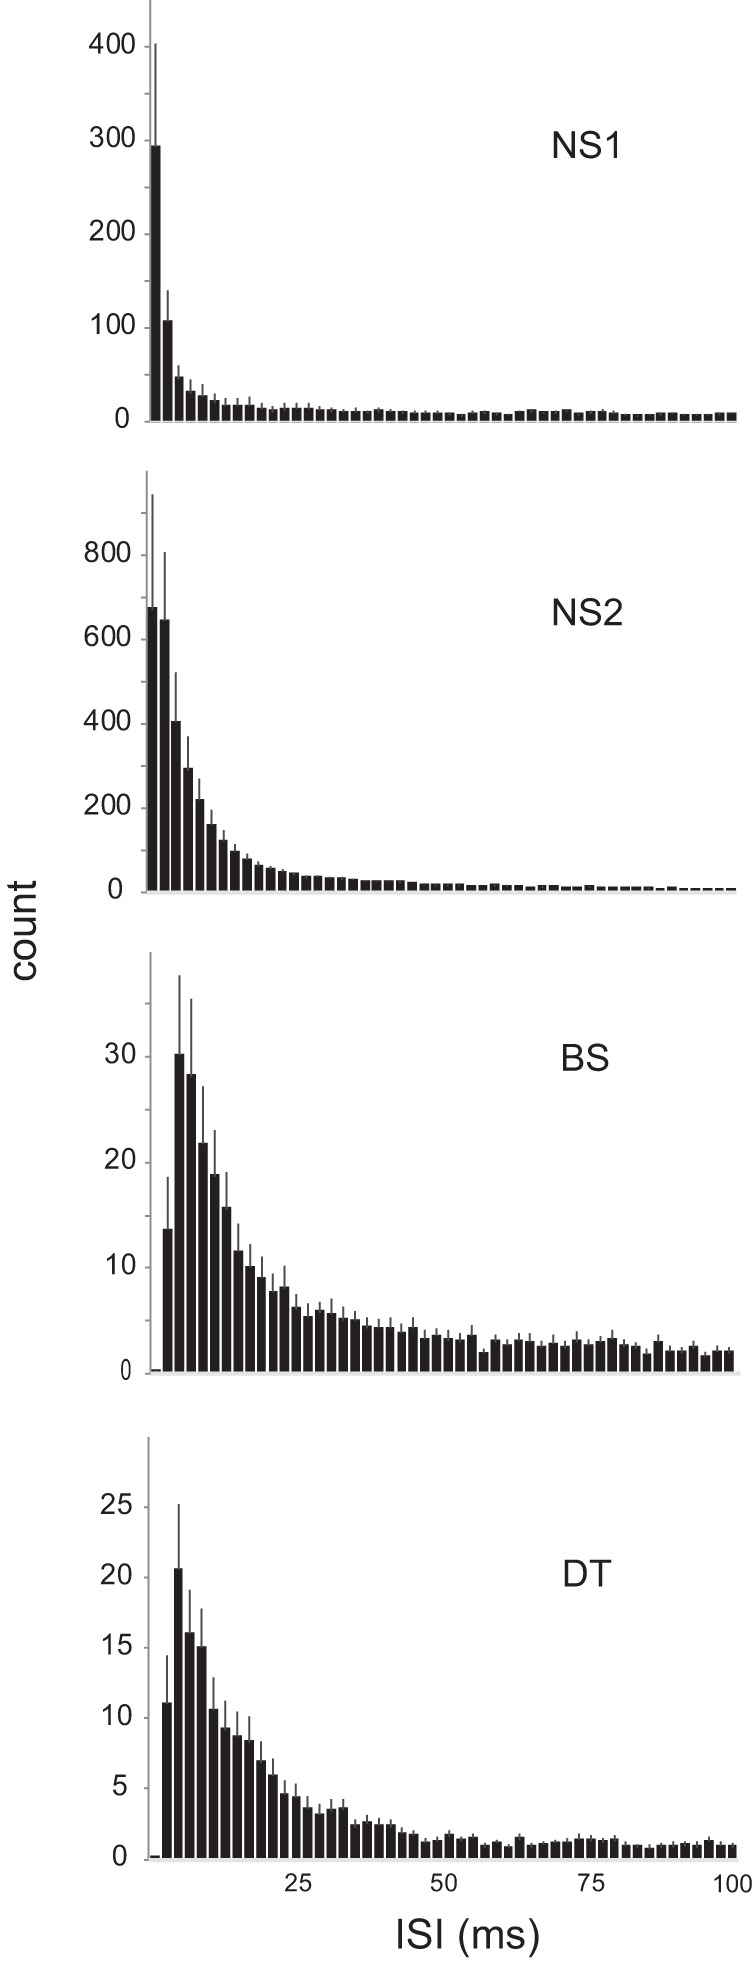
Distribution of ISIs from 1 to 100 ms in each cell group. Frequency distributions of ISIs across all excited responses for intervals up to 100 ms in each group. NS, narrow spiking; BS, broad spiking; DT, double trough. See results.

Distribution of ISIs from 1 to 100 ms in each cell group. Frequency distributions of ISIs across all excited responses for intervals up to 100 ms in each group. NS, narrow spiking; BS, broad spiking; DT, double trough. See results.