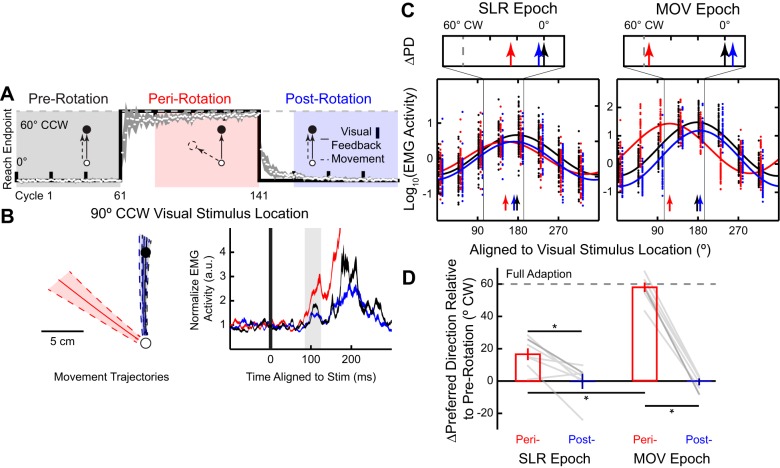
Fig. 2.
Partial adaptation of the stimulus-locked response (SLR) tuning during the abrupt visuomotor rotation task. A: timeline and behavioral performance during a 60° clockwise (CW) abrupt visuomotor rotation. Group mean (±SE; white circles and shaded line) reach end point per cycle relative to the stimulus location is plotted against perfect task performance (black line). Veridical visual feedback was provided during pre- (black) and postrotation (blue) blocks. During the perirotation (red) block, the virtual cursor feedback was rotated around the start position by 60°CW. B and C: electromyography (EMG) data from the representative participant. B: normalized mean (±SD) movement trajectories and mean (±SE) right pectoralis major EMG activity (a.u., arbitrary units) for the outward visual stimulus location of a representative participant. The EMG activity is aligned to stimulus onset, and the SLR epoch (85–125 ms after stimulus onset) is highlighted. C: sinusoidal tuning curve fits (Eq. 1) between visual stimulus location and the normalized mean EMG activity during the SLR (left) and reach-related movement (MOV) epochs (right). Each dot indicates data from a single trial, and solid lines show the best fit for each block; vertical arrows indicate the preferred directions (PDs) for each fit. Note for illustration purposes only, we have staggered the individual trial data. Top insets show the shifts in PD (∆PD) during the peri- and postrotation blocks relative to the prerotation block. Vertical dashed gray line represents full adaptation to the 60°CW visuomotor rotation. D: group mean (±SE) ∆PD for both perirotation (red bars) and postrotation blocks (blue bars) during both the SLR and MOV epochs across all participants. ∆PD = 0° or ∆PD = 60°CW would indicate either no adaptation or a complete adaptation to the imposed rotation, respectively. Each gray line represents data from an individual participant, with the darker gray line indicating data from the participant in C. *P < 0.05.

