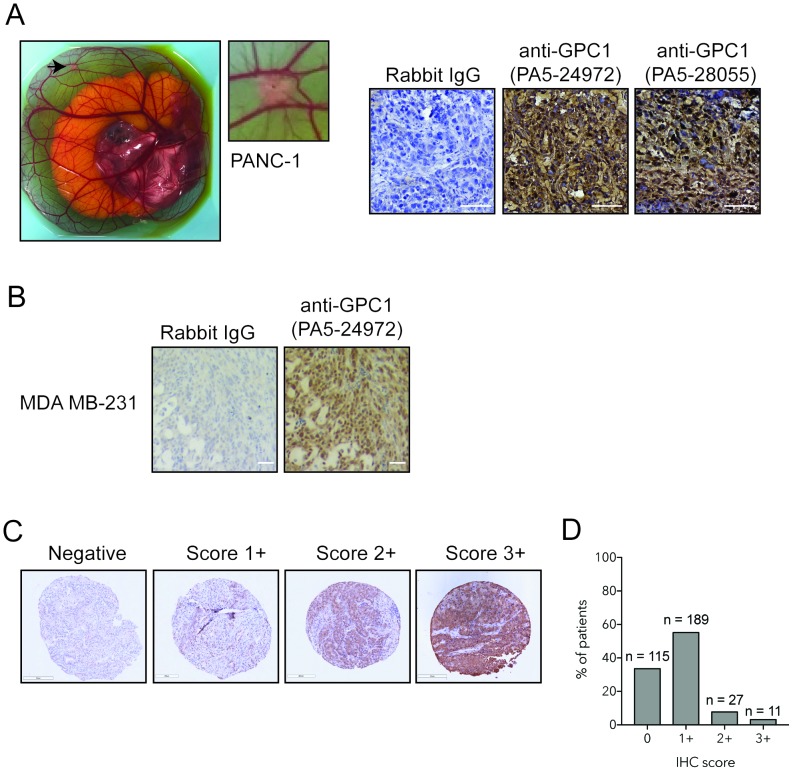
Figure 3. GPC1 expression in tissue microarray of human PDAC.
(A) Photomicrograph representing a PANC-1 tumor xenograft onplanted into chorioallantoic membrane of a chicken embryo. Immunohistochemical staining was performed with GPC1 antibody clones PA5-29472 PA5-28055. Bar: 20 μm. (B) Immunohistochemical staining of MDA-MB 231 cells with GPC1 antibody PA5-24972 or isotype-matched control (rabbit IgG), Bar: 20 μm. (C) Tissue Microarray of human PDAC tumors stained with GPC1 antibody PA5-29472. Representative images of differential expression of GPC1: negative (0), weak (1+), moderate (2+), strong (3+), Magnification 10x. (D) Immunohistochemical score for GPC1 expression in tissue microarray of human PDAC. N indicates number of cores for each IHC score.

