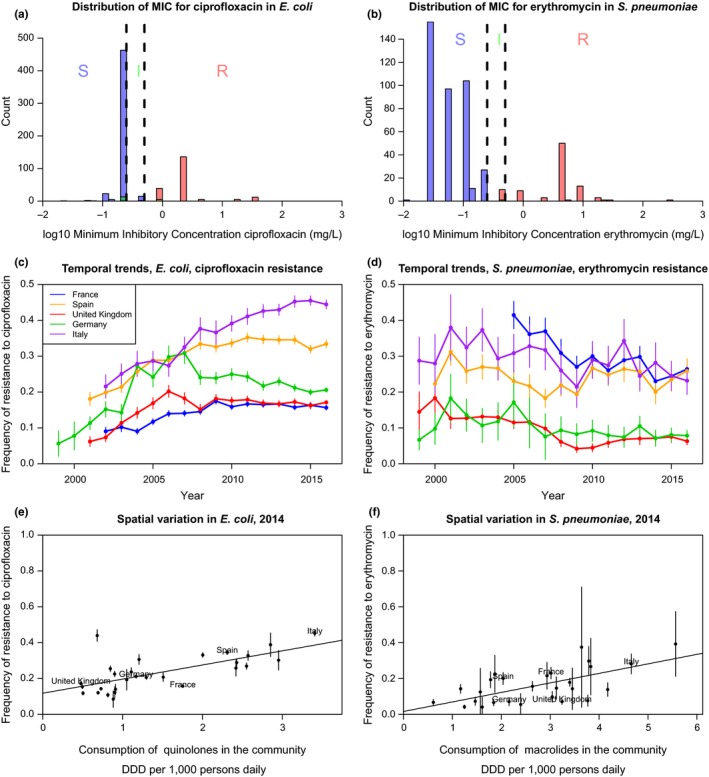
Figure 1.

The distribution of minimum inhibitory concentration (MIC), temporal and spatial trends in resistance in Europe over the last 30 years (data from the European Center for Disease Prevention and Control or ECDC), for two example bacterial species and resistances. On the left panels (a, c, e), resistance to ciprofloxacin (a quinolone) in Escherichia coli, a Gram‐negative commensal colonizing the gut of virtually all humans, as well as domestic and wild animals and persisting in the environment, and an opportunistic pathogen causing infections responsible for about a million death each year (Denamur, Picard, & Tenaillon, 2010). On the right panels (b, d, f), resistance to erythromycin (a macrolide) in Streptococcus pneumoniae, a Gram‐positive colonizing the nasopharynx of children and the elderly, specialized on humans, causing infections responsible for about a million death each year (O'Brien et al., 2009). The top panels (a, b) show the distribution of the minimum inhibitory concentration at year 2016. The colour of the bar denotes the resistance status (I: intermediate; R: resistant; S: sensitive) according to the EUCAST breakpoints (vertical dashed lines). The resistance status may not match exactly because of misclassification and/or conflicting results between different tests. The middle panels (c, d) show the temporal trends in the frequency of resistance in five large European countries (vertical lines show the 95% binomial confidence intervals). The bottom panels (e, f) show the correlation between the frequency of resistance and the consumption of the relevant class of antibiotic in the community across European countries (vertical lines show the 95% binomial confidence intervals)
