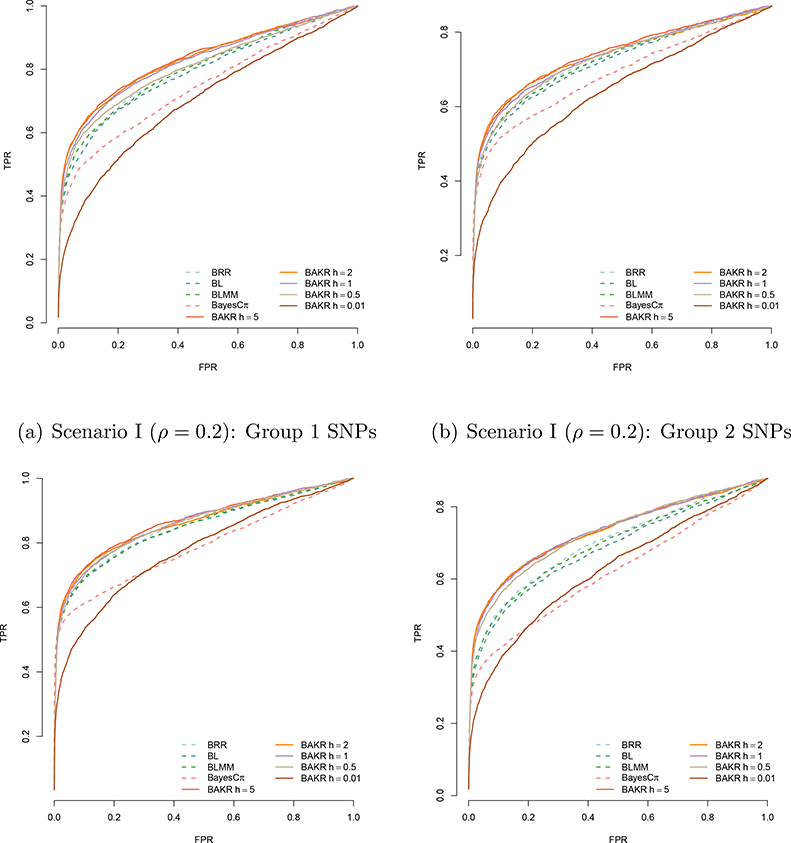
Figure 1:

Power analysis comparing Bayes Ridge (BRR), Bayes Lasso (BL), Bayes LMM (BLMM), Bayes Cπ, and BAKR approximating Gaussian kernels with bandwidth parameter values h. BAKR models are illustrated as a solid lines, while the competing models are shown as dotted lines. Group 1 SNPs are those that exhibit additive effects, while the SNPs in group 2 are those involved in interactions. Results are based on 100 different simulated datasets in each scenario.
