
Figure 1.
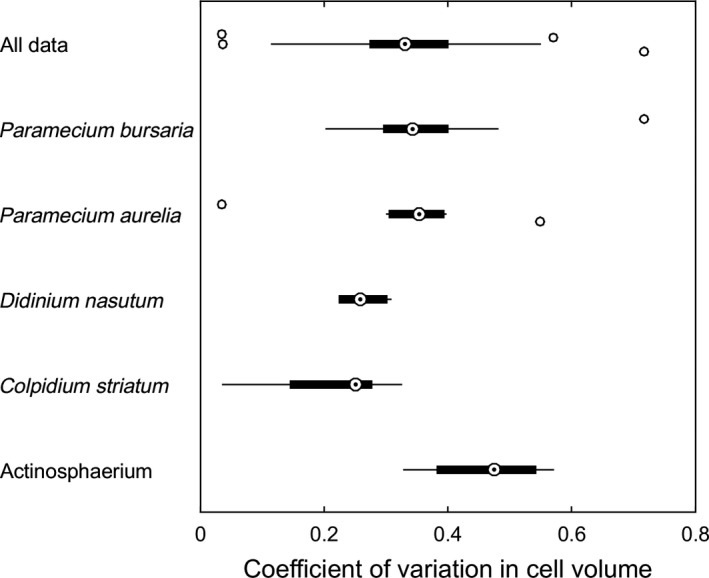
Variation in cell volume for protists. Each point in the distributions is a separate sample for the indicated species, taken from different studies, different treatments, or different days within a study. On the whole, the amount of cell volume variation in a population is highly variable, but the approximate center of the observations is CV = 0.3. We therefore use this value in our initial GEM analysis. Sources are Paramecium bursaria (Luhring & DeLong, 2017), Paramecium aurelia (DeLong, Hanley, & Vasseur, 2014; DeLong & Vasseur, 2012b), Didinium nasutum (DeLong et al., 2014), Colpidium striatum (DeLong & Vasseur, 2012b; Jiang & Morin, 2005), and Actinosphaerium sp. (DeLong, 2012)