Figure 2.

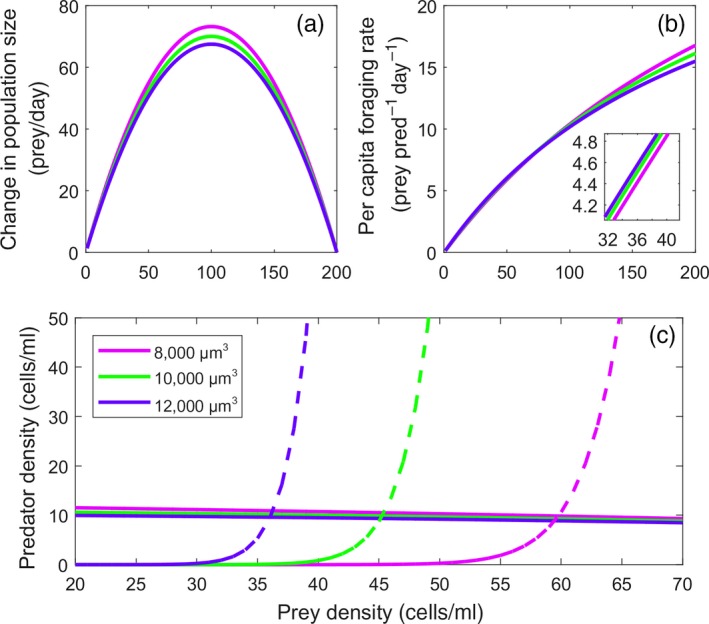
Prey mass affects growth, foraging rates, and equilibrium abundances. (a) Change in population size with population size for small (0.8×104 µm3 cell volume, purple), medium (1×10⁴, green), and large (1.2×10⁴, blue) prey. (b) Variation in the functional response for small, medium, and large prey. Although difficult to see, the purple curve has a shallower slope than the other curves at low prey density (inset), indicating that smaller prey may be consumed relatively less when rare. (c) Zero net growth isoclines for predator (dashed) and prey (solid) for Equations (1A), (1B) with three levels of prey size. There is little variation in the prey isocline relative to the predator isocline. The predator isocline moves to the right as prey size declines, indicating that the equilibrium population size for prey is higher for smaller individuals
