
Figure 4.
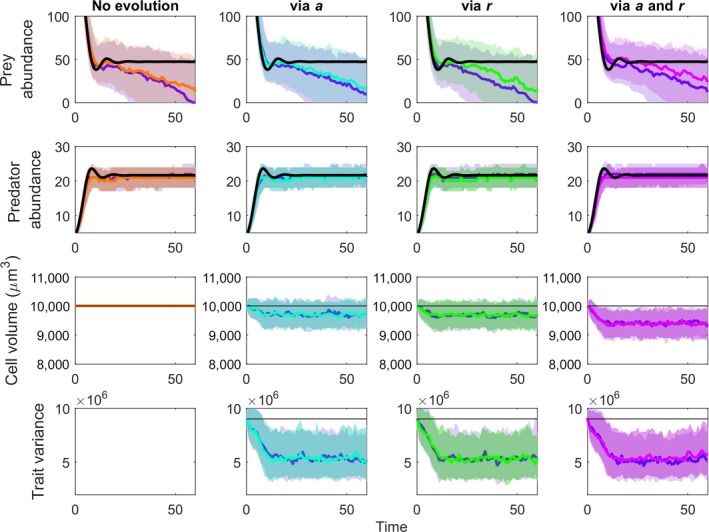
Eco‐evolutionary dynamics of predator, prey, and prey body size where the body size is connected to different functional aspects of the predator–prey interaction. Each column shows dynamics for different scenarios. In column 1, there is no trait variation, so no‐evolution is possible. In columns 2‐4, prey size is connected to the functional response parameter space clearance rate (a), prey growth rate (r), or both, respectively. In the top two rows, the solid black line indicates the no‐evolution standard ODE solution of Equations (1A), (1B). In each box, two scenarios are shown. The bold blue line and light blue shading show the median and middle 50% of simulations for the GEMs without the indirect effect of predator conversion efficiency (e) on the dynamics. The other bold color lines and shaded areas show the median and middle 50% of simulations of the GEMs with the indirect effect of predator conversion efficiency. Each column is given a different color to link the dynamics in this figure with the evolutionary rescue outcomes in Figure 5. From top to bottom, the rows show prey density, predator density, mean trait (cell volume), and variance in the trait