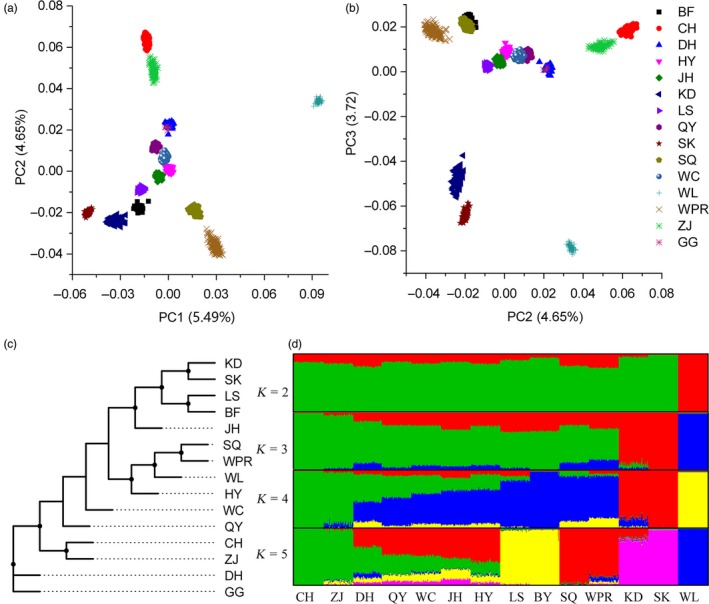
Figure 2.

Population structure for all chickens. (a) Principal component analysis (PCA) plot based on PC1 against PC2 and (b) PC2 against PC3; (c) phylogenetic relationships for all populations; (d) genetic structure and individual ancestry. Colours in each column represent ancestry proportion over the range of population sizes K = 2–5
