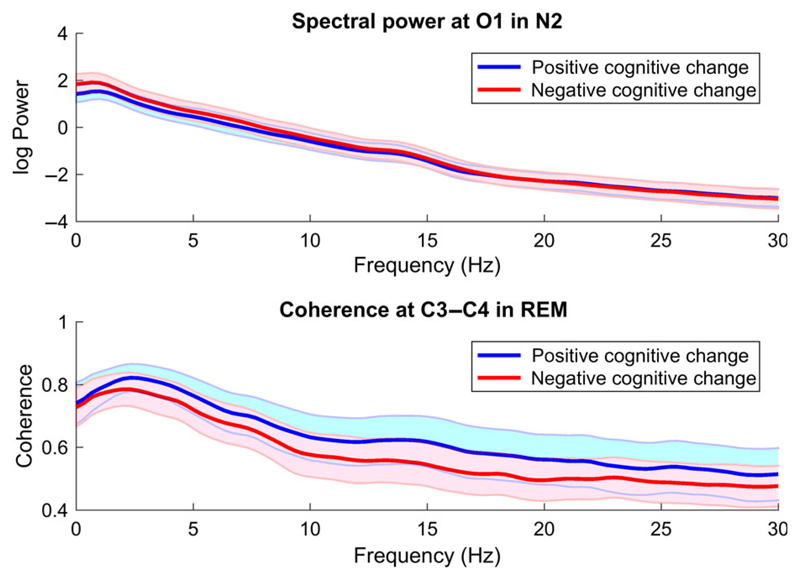
Figure 2.
Group-wise mean (thick lines) and standard deviation (shaded areas) of absolute spectral power in O1 during N2 sleep (upper panel) and of coherence in C3-C4 during REM sleep (lower panel). Subjects with negative cognitive change exhibit higher low-frequency power ("slower" EEG) and lower inter-hemispheric coherence (functional disconnection)

