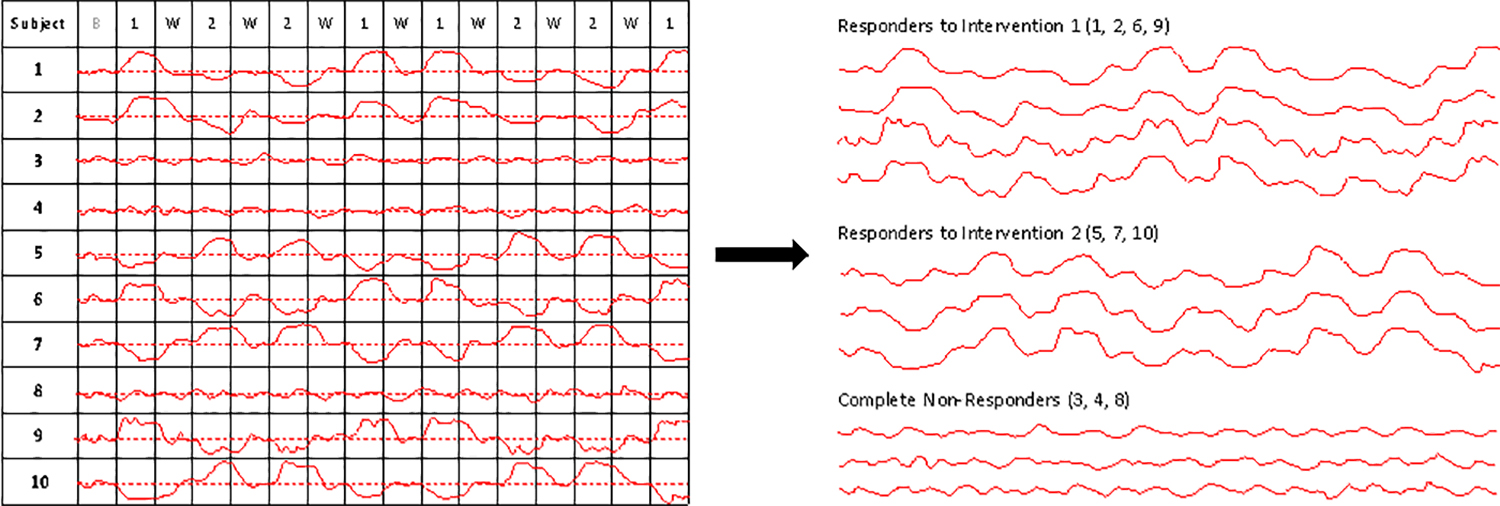
Figure 2.

A graphical depiction of the result of aggregating the outcomes of 10 different N-of-1 studies. For the left panel, it is assumed that each individual underwent an N-of-1 trial with a similar design in which interventions were alternated after a baseline and washout periods. As with Figure 1, the dashed red line corresponds to values of a measure that are not associated with a favorable or unfavorable response to the interventions, but are ambiguous with respect to response. The solid red lines provide the values of hypothetical continuous measure made on an individual, with greater values than the red dashed line indicating a positive response and lesser values indicating a negative response. The right panel depicts the results of a clustering of the individual responses, with some individuals exhibiting a greater response to intervention 1 (upper set of curves), some individuals exhibiting a greater response to intervention 2 (middle set of curves) and some individuals exhibiting a lack of response to either intervention.
