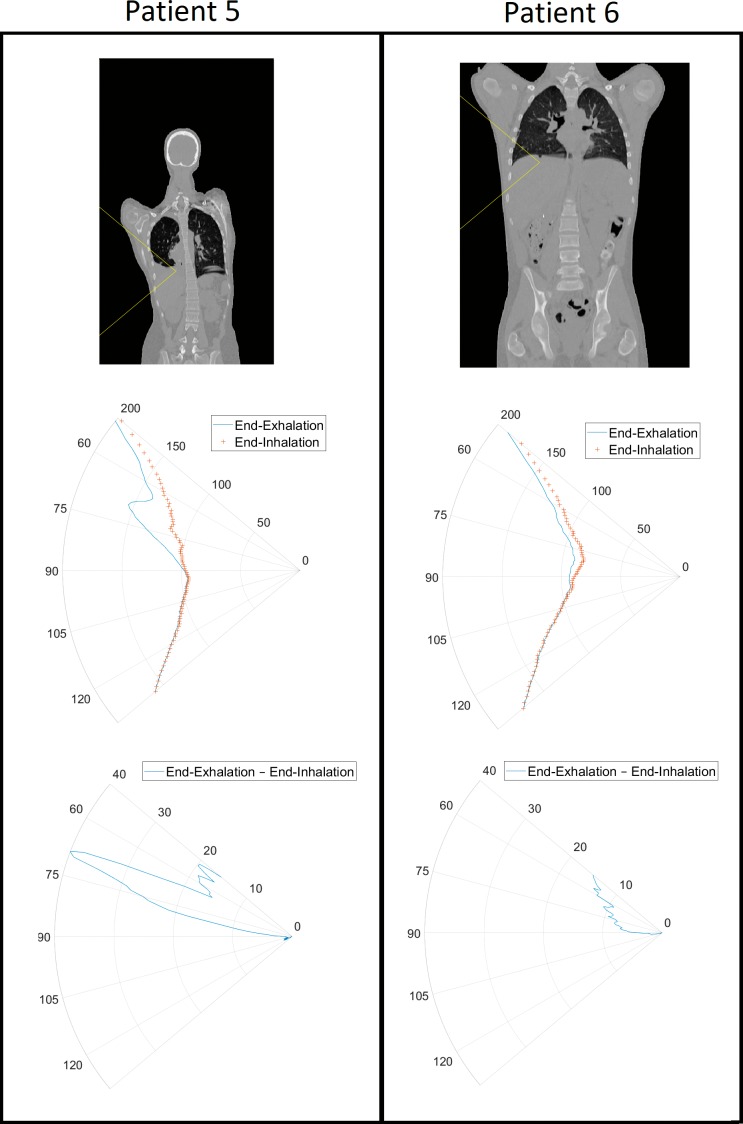
Figure 3.
Water equivalent thickness (WET) as a function of gantry angle plots for patients 5 and 6 over the span of 50° to 130°. The top set of figures shows the angular distribution in a coronal slice of the body at the end of exhalation that the WET is being measured in. The middle set of figures shows the WET in millimeters as a function of angle at the end of exhalation and at the end of inhalation. The bottom set of figures shows the difference in WET in millimeters between the end of exhalation and the end of inhalation.

