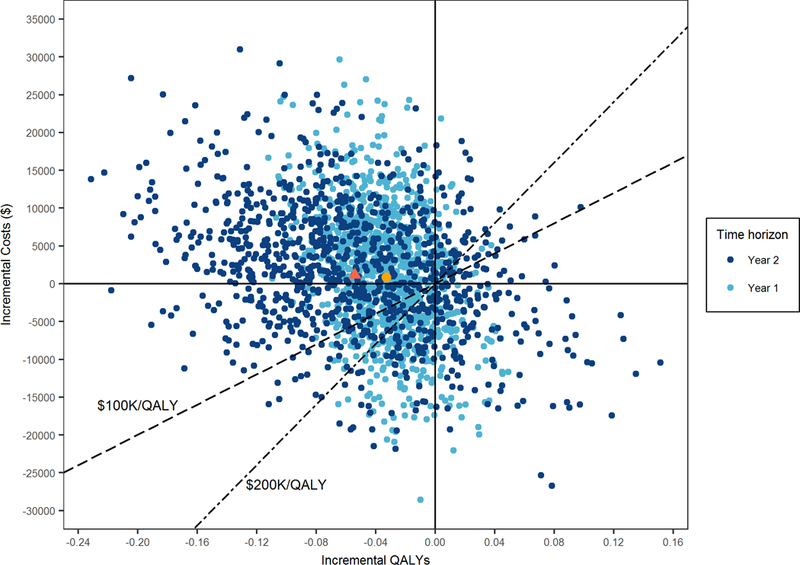
Figure 3. Within-trial cost-effectiveness analysis bootstrap results comparing replacement vs repair.

Shown are Δs in average costs and average QALYs as measured in each bootstrap replicate of the trial data with repair as the reference strategy. The yellow and red figures represent the point estimates (Δcosts, ΔQALYs) at 1-year ($848; −0.03) and 2-year ($1,166; −0.05) respectively. The two diagonals represent commonly used cost-effectiveness thresholds of $100K/QALY and $200K/QALY. The proportion of iterations below or to the right of the selected diagonal equals the likelihood of the replacement strategy being cost-effective as compared with repair given the applicable cost-effectiveness threshold.
