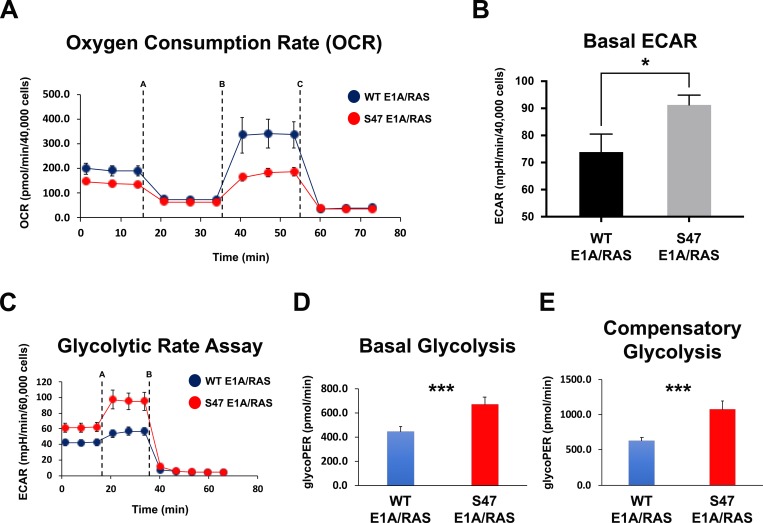
Figure 1. Increased use of glycolysis in tumor cells with the S47 variant of p53.
(A) WT and S47 E1A/RAS MEFs were subjected to the Seahorse XF Cell Mito Stress Test. Each graphical representation indicates the mean ± standard deviation of technical replicates. Shown are representative data of two independent clones of each genotype. Injections were Oligomycin (1 μM, line A), FCCP (1 μM, line B), and Rotenone/Antimycin A (0.5 μM, line C). (B) Quantification of the basal extracellular acidification rate (ECAR) between WT and S47 E1A/RAS MEFs from the Mito Stress Test performed in (A). Each graphical representation indicates the mean ± standard deviation of technical replicates; *p < 0.05. (C) WT and S47 E1A/RAS MEFs were subjected to the Seahorse XF Glycolytic Rate Assay. Injections were Rotenone plus Antimycin A (0.5 μM, line A), and 2-deoxy-D-glucose (2-DG, 50 mM, line B). Shown are representative data of two independent clones of each genotype. (D) Basal glycolysis and (E) compensatory glycolysis were analyzed between WT and S47 E1A/RAS MEFs. All experiments were performed in triplicate, with each group containing 5–10 technical replicates. ***p < 0.001. glycoPER: Glycolytic proton efflux rate.

