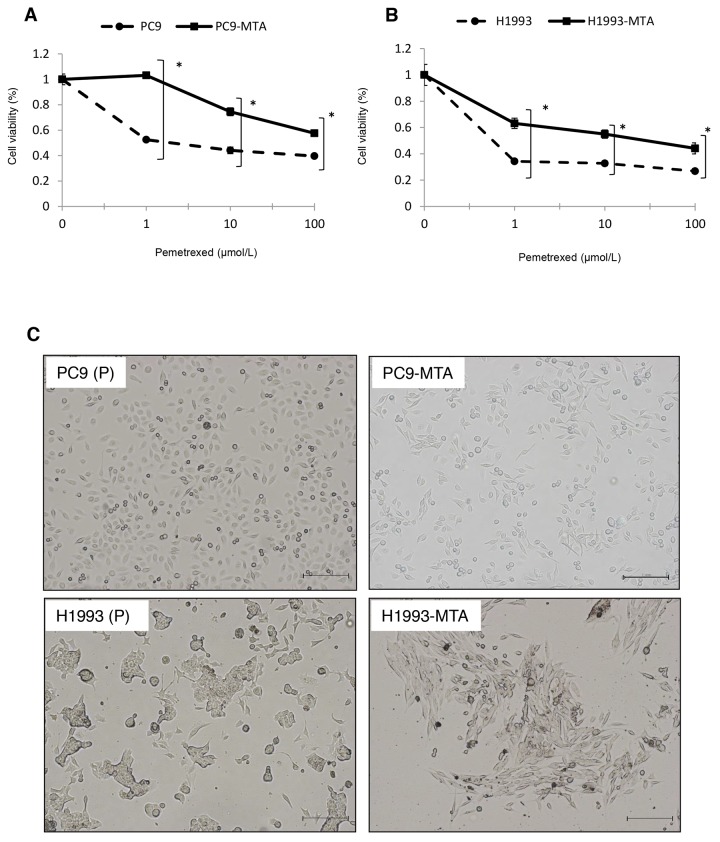
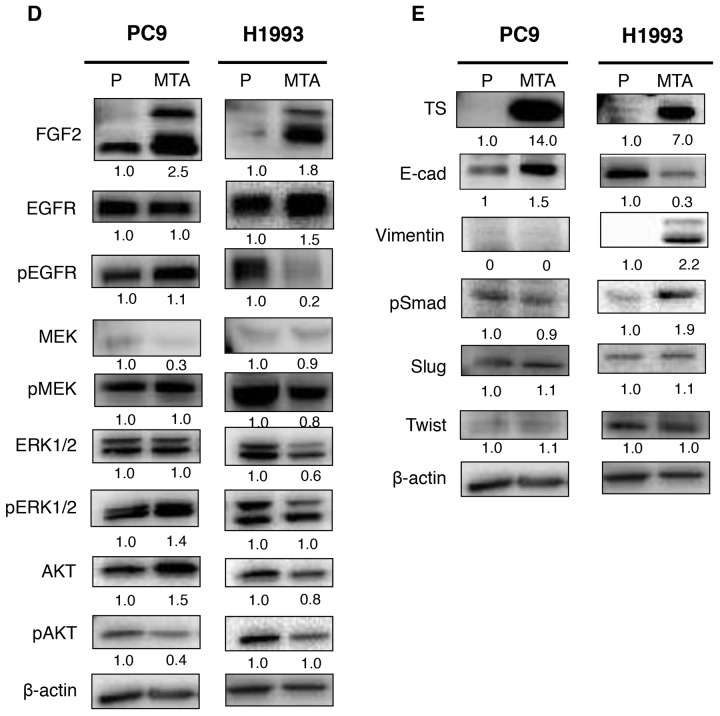
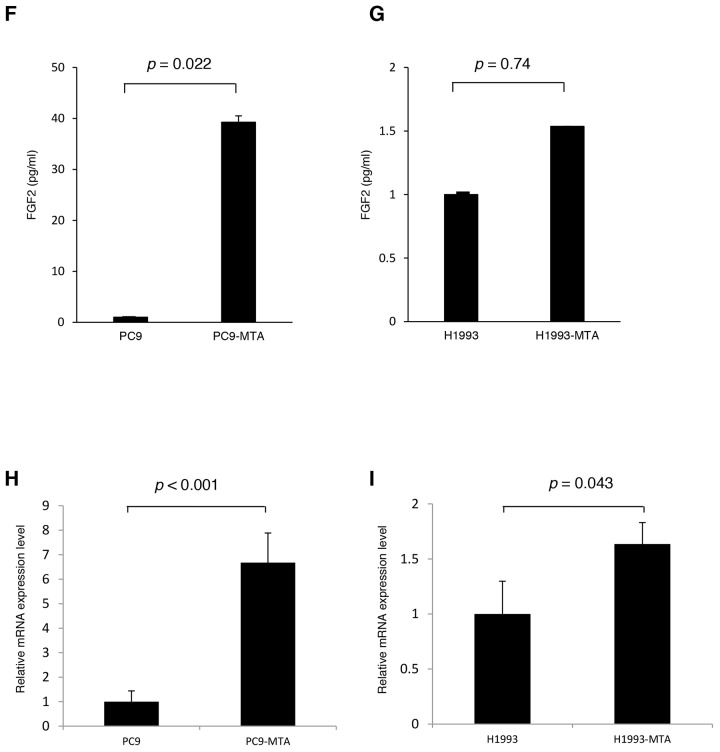
Figure 1. Characteristics of pemetrexed-resistant lung cancer sublines and their parental cells.
Sensitivity to pemetrexed in pemetrexed-resistant lung cancer sublines and their parental cells. (A, B) Pemetrexed-resistant lung cancer cell lines were obtained by culturing PC9 and H1993 cells with stepwise-increasing doses of pemetrexed for over 6 months. Sensitivity to pemetrexed was determined by using WST assays. Each cell line with “P” indicates a parental cell line, and “-MTA” indicates an established pemetrexed-resistant subline. Closed circles (●) indicate parental cells, whereas closed squares (■) indicate pemetrexed-resistant cells. The error bars represent the standard error of the value obtained in the experiments performed in triplicate.Morphological findings of pemetrexed-resistant lung cancer sublines and their parental cells. (C) Representative pictures of the morphological findings of the parental PC9 cells (PC9-P), PC9-MTA cells, parental H1993 cells (H1993-P), and H1993-MTA cells. Scale bars = 500 μm. Comparison of signaling pathway molecules and EMT marker proteins between parental and pemetrexed-resistant lung cancer cells. (D) Western blot analyses of the expression of total or phosphorylated forms (pEGFR, pMEK, pERK, and pAKT) of signaling molecules in the parental PC9 cells (PC9-P), PC9-MTA cells, parental H1993 cells (H1993-P), and H1993-MTA cells. β-actin was used as a loading control.The experiments were repeated independently at least three times, and one representative blot is provided in the figures. The quantitative numbers of relative expression levels corrected by β-actin are demonstrated below the picture of the blots. The phosphorylated proteins were normalized to their total amounts. (E) Western blot analyses of the expression of TS and EMT marker proteins in PC9-P, PC9-MTA, H1993-P, and H1993-MTA cells. (F, G) Comparison of FGF2 protein expression levels in serum-free conditioned media measured by ELISA between PC and PC9-MTA cells (F) and between H1993 and H1993-MTA cells (G). (H, I) FGFR1 expression quantitated by real-time RT-PCR in PC9 and PC9-MTA cells (H) and in H1993 and H1993-MTA cells (I). The error bars in each graph represent the standard error of the value obtained in the experiments performed in triplicate.


