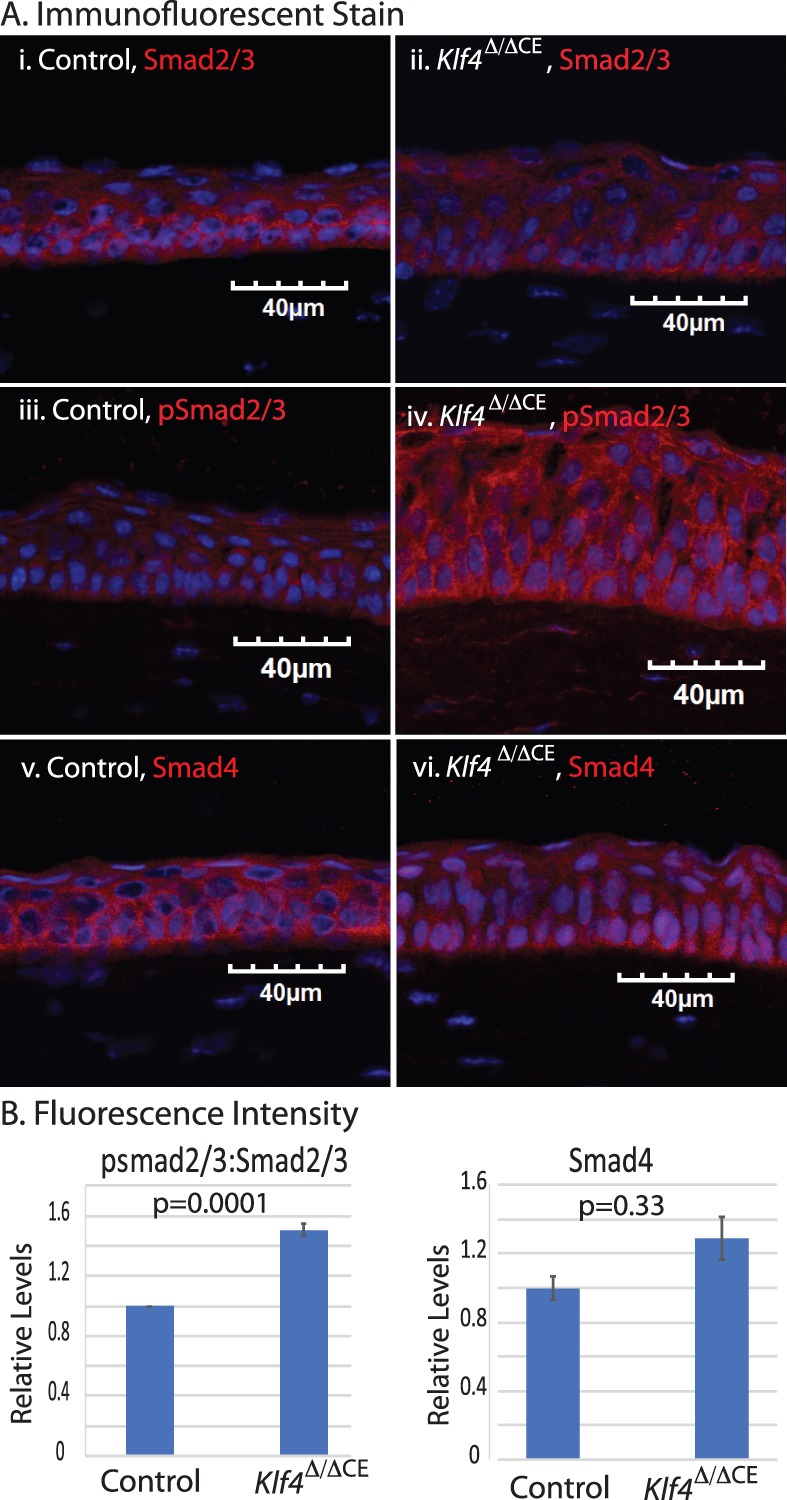
Figure 4.

Canonical Smad2/3 signaling pathway is activated in Klf4Δ/ΔCE cells. (A) Expression of Smad2/3, pSmad2/3, and Smad4 in Klf4Δ/ΔCE and control CE visualized by immunofluorescent stain. (B) Bar graph shows fluorescence intensity, pSmad2/3:Smad2/3 ratio (left), and Smad4 (right). Data show results from three independent experiments reported as means ± SEM. Image acquired at 40×; scale bar: 40 μm.
