Figure 6.

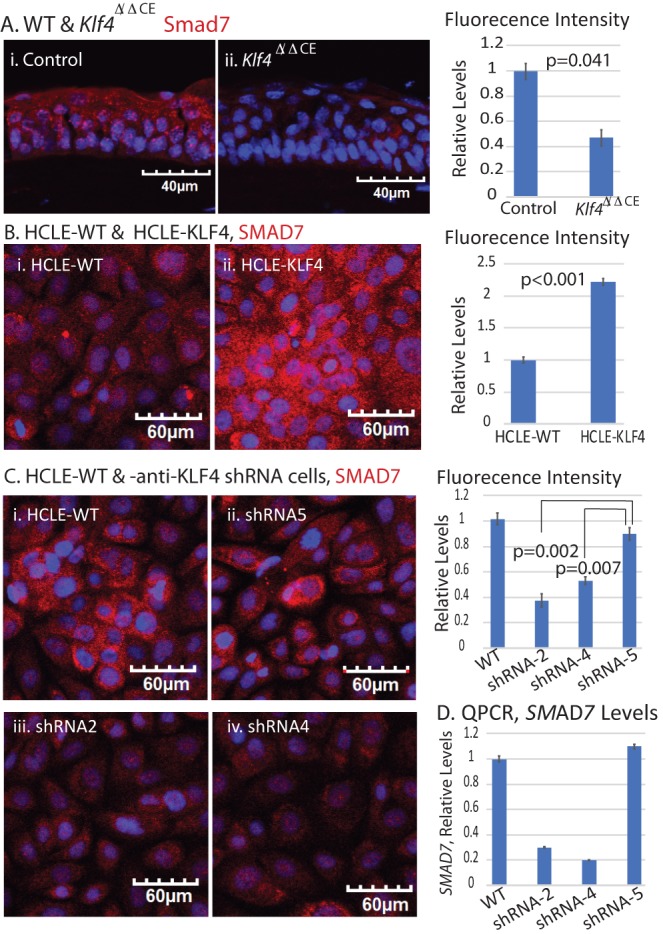
KLF4 regulates SMAD7 expression in CE cells. (A) Immunofluorescent stain and corresponding fluorescence intensity bar graph, showing significant decrease in Smad7 in Klf4Δ/ΔCE cells compared with the control. (B) Immunofluorescent stain and corresponding fluorescence intensity bar graph, showing significant increase in SMAD7 expression in HCLE-KLF4 cells. (C) Immunofluorescent stain and corresponding fluorescence intensity bar graphs showing significant decrease in SMAD7 expression in HCLE-KD compared with the control cells. Images were acquired at 20×; scale bar as shown. (D) qPCR confirming the downregulation of SMAD7 transcripts in HCLE-KD compared with the control cells. Data show results from two independent experiments performed in triplicate and reported as means ± SEM.
