
Figure 3.
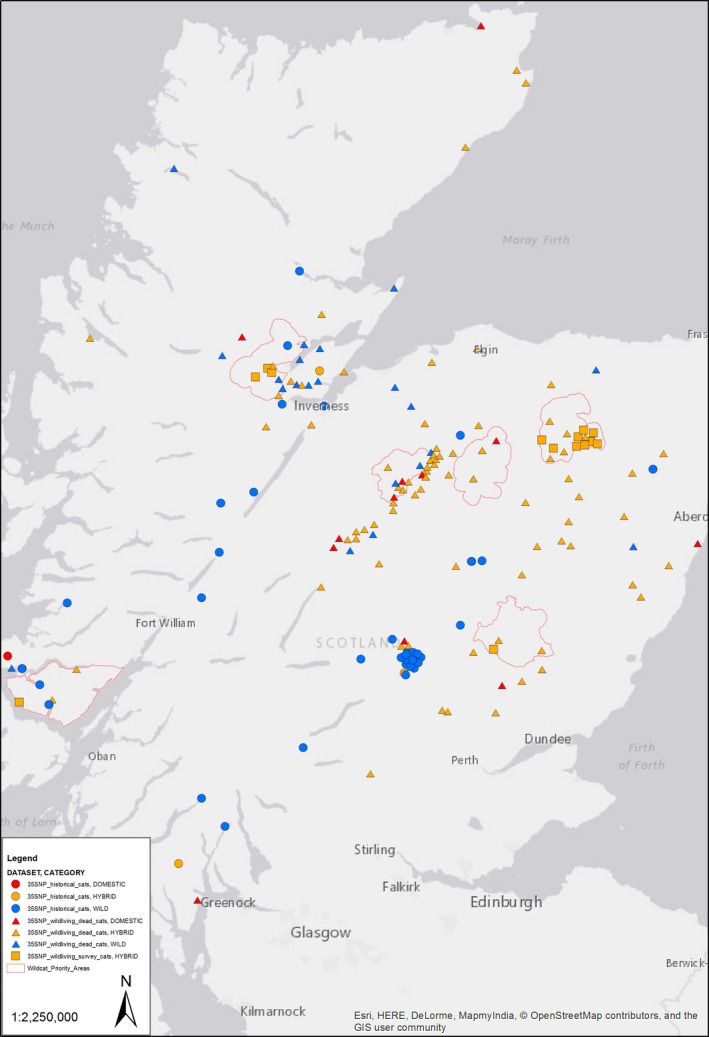
A map of Scotland with the locations of cats samples within the datasets 35SNP_historical_cats (circles), 35SNP_wildliving_dead_cats (triangles) and 35SNP_wildliving_survey_cats (squares). Where only a verbal location was given, the approximate location was chosen with the aid of Google Maps (e.g., the blue cluster in the map centre). Overlapping points were separated manually for ease of viewing, whilst respecting the boundaries of the Wildcat Priority Areas which are given in red. Points are coloured using the same genetic categories used for Figure 2