
Figure 4.
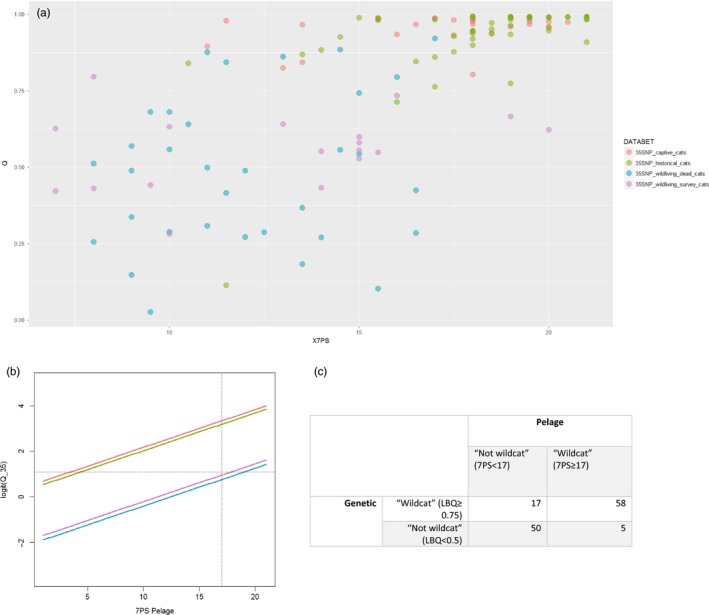
(a) The relationship between Q_35 and the 7PS pelage score. (b) Prediction from the model in Table 2 for logit‐transformed Q_35. Dashed lines represent the cut‐off values of Q = Logit(0.75) and 7Ps = 17 for genetic and pelage systems, respectively. (c) The number of individuals in the genetic and pelage categories for management purposes