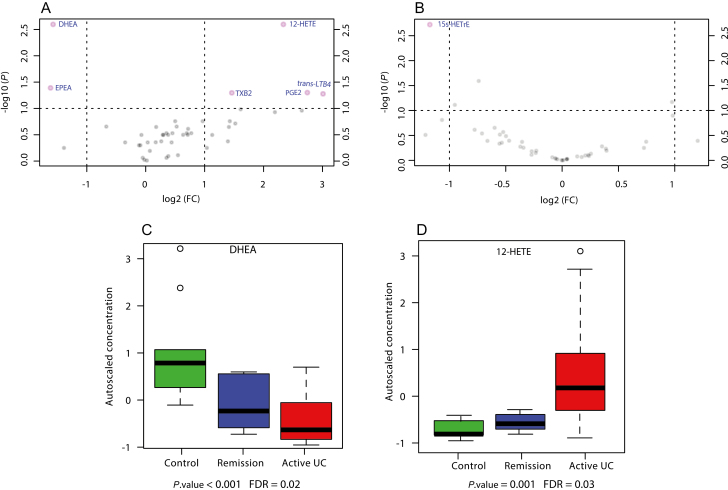
FIGURE 1.
Results from univariate analysis of oxylipin and eCB mean mucosal concentrations. A, B, Volcano plots of changes in mean mucosal concentrations of oxylipins and eCBs in treatment-naïve patients vs healthy controls (HCs), and UC deep remission patients vs HCs, respectively. The vertical lines correspond to 2.0-fold up- and downregulation, and the horizontal lines represent a P value of 0.05 (Mann-Whitney U test) at a cutoff FDR value of 0.1. The points in the plots represent metabolite mean concentrations. Metabolites in pink have passed the volcano plot filtering. C, D, Box plots of the autoscaled concentration of DHEA and 12-HETE, respectively. The mean concentrations of these metabolites were found to have significantly changed among the study groups according to Kruskal-Wallis analysis of variance.

