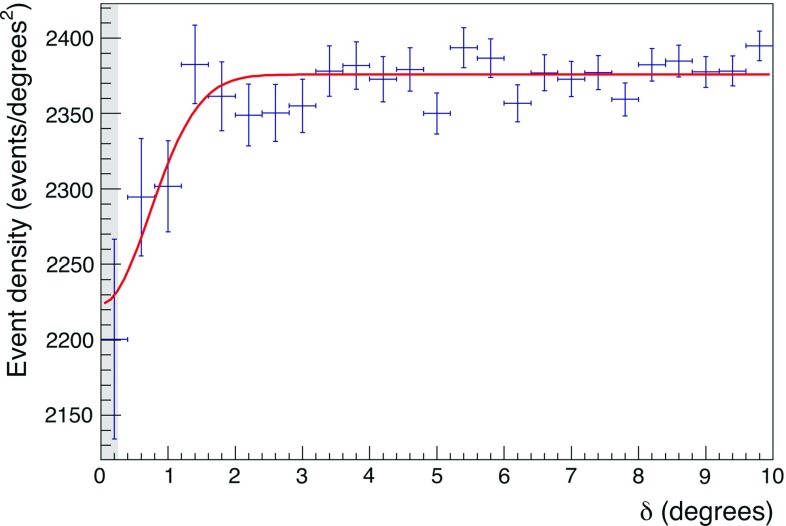
Fig. 3.
Measured muon event density as a function of the angular distance from the Moon. Data histogram is shown with statistical errors; the smooth line is the best fit according to Eq. (4); the shaded area corresponds to the apparent radius of the Moon ()

