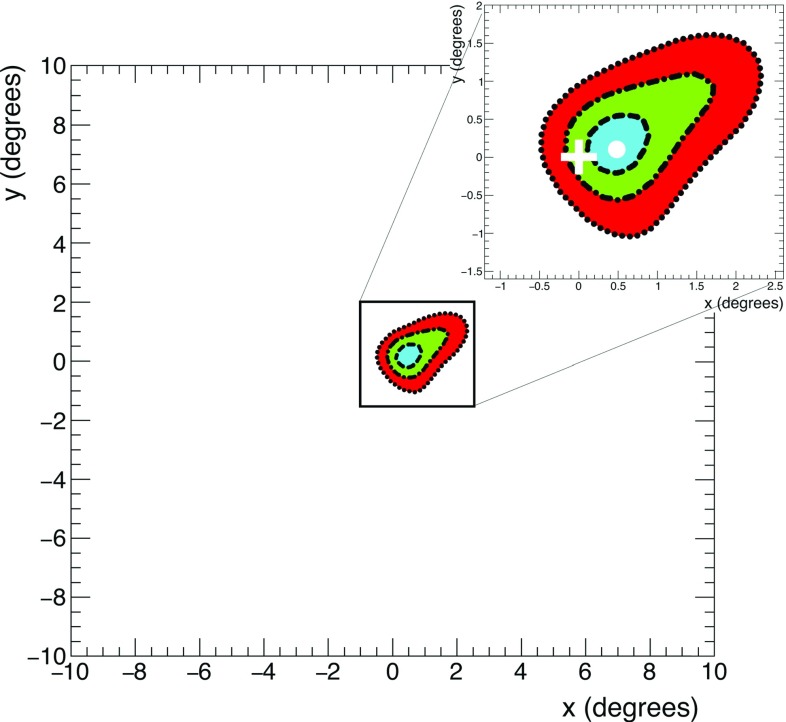
Fig. 6.
Contour plots corresponding to different confidence levels (cyan/dashed: 68.27%; green/dot-dashed: 95.45%; red/dotted: 99.73%), computed with the two methods described in the text. In the zoom, the dot represents the position in the FoV where . The cross indicates the nominal position of the Moon

