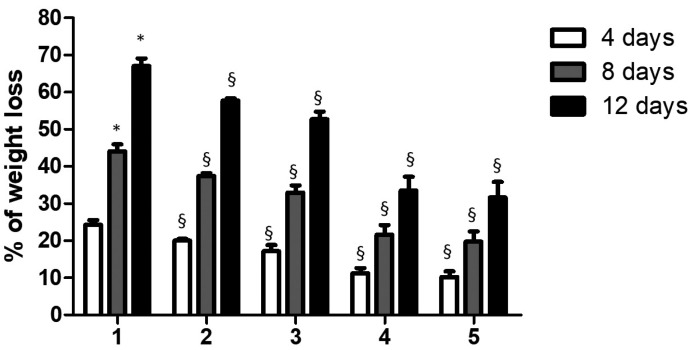
Figure 2.
Relation between weight loss of enamel teeth specimens and time. The mass loss was calculated as a percentage of that observed prior the protective pastes or water (control) application (mass set to 0%). The reported data are the mean values (+/- SD). Symbol (*) indicates statistically significant differences (p < 0.01) in group 1 as determined by repeated-measures one-way ANOVA with a Bonferroni’s post hoc tests. Symbol (§) indicates statistically significant differences (p < 0.01) between group 1 and towards each other group as determined by repeated-measures one-way ANOVA with a Bonferroni’s post hoc tests.

