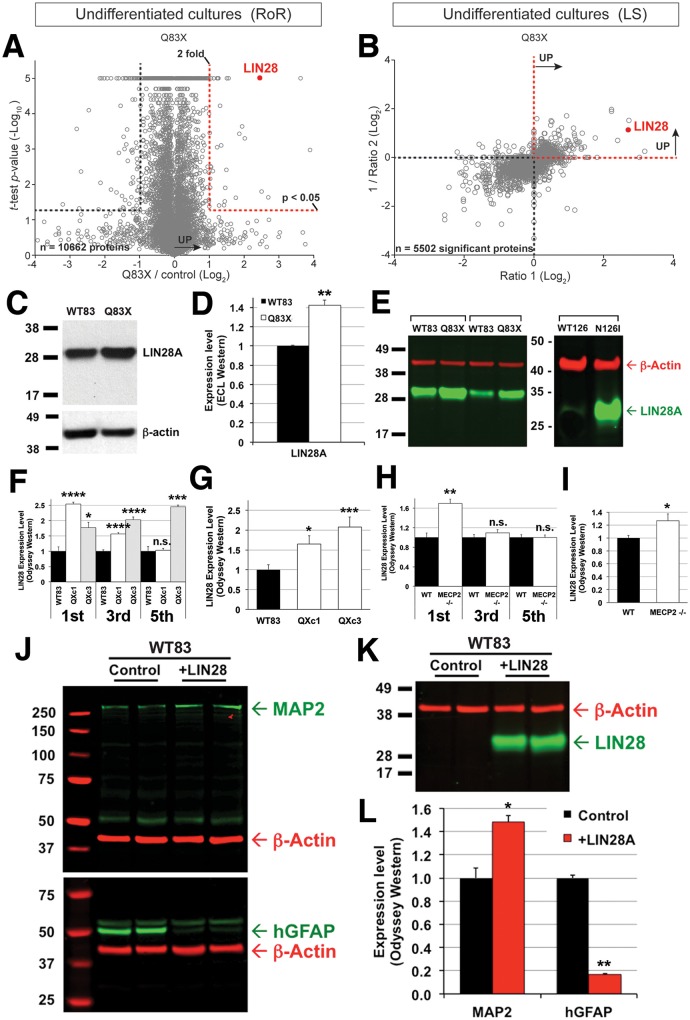
Fig 3. LIN28 expression is elevated in MECP2 mutant NPCs and results in suppression of GFAP expression.
A. Volcano plot showing confidently quantified proteins by LC-MS in WT83 and Q83X comparison by the RoR paradigm. The red dotted line demarcates proteins that have a t-test p-value < 0.05 (FDR = 0.15) and that are upregulated by at least 2-fold. N = 10662 proteins. B. Scatter plot showing all confidently quantified proteins by LC-MS in WT83 and Q83X comparison by the LS paradigm that are significantly differentially expressed. N = 5502 significant proteins, t-test p-value < 0.05 (FDR = 0.15). C. Enhanced chemiluminescence (ECL)-based Western blot of LIN28 expression in WT83 and Q83X NPC extracts. D. Quantification of ECL-based Western blot bands. For all bar graphs in D-L, * p-value <0.05, ** p-value <0.02, *** p-value <0.001, and **** p-value <0.0001 by a two-tailed unpaired t-test. E. IRFL-based Odyssey Western blot of LIN28 (green) and beta-Actin (red) expression in WT83, Q83X, WT126, and N126I NPC extracts. For WT83 and Q83X, two different sets of clones were used. F. Quantification of LIN28 expression using Odyssey Western blots in WT83 and two clones of Q83X NPCs harvested on the 1st, 3rd, and 5th passages after thawing. G. Averaged LIN28 expression in the three NPC passages shown in F. H. Quantification of LIN28 expression using Odyssey Western blots in WT and MECP2 -/- hESC-derived NPCs harvested on the 1st, 3rd, and 5th passages after thawing. I. Averaged LIN28 expression in the three NPC passages shown in H. J.Odyssey Western blots showing expression of MAP2 (upper blot, green), GFAP (lower blot, green), and beta-Actin (red), in uninfected (Control) or LIN28-overexpressing (+LIN28) WT83 NPCs after 3 weeks of differentiation. K. Odyssey Western blots showing expression of LIN28 (green) and beta-Actin (red), in uninfected (Control) or LIN28-overexpressing (+LIN28) WT83 NPCs after 3 weeks of differentiation. L. Quantification of IRFL-based Western blot bands for MAP2 and GFAP shown in J.

