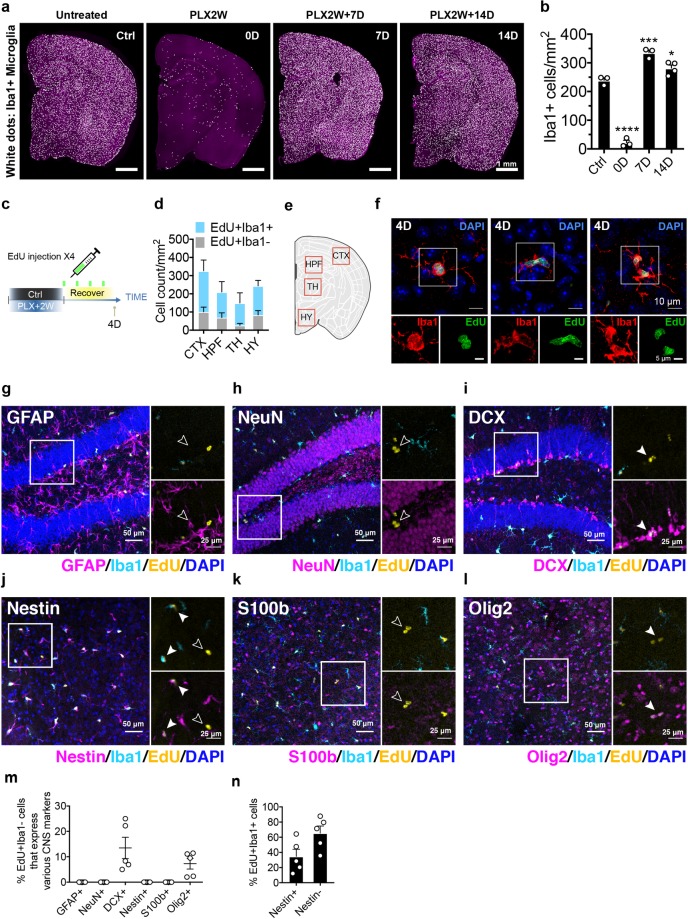
Fig 1. Release from CSF1 inhibition triggers proliferation of microglia and a nonmicroglial population.
(a) Stitched image of coronal section showing microglial density at steady state (Ctrl), after 2 weeks of PLX5622 treatment (PLX2W), repopulation for 7 days (PLX2W + 7 D), and repopulation for 14 days (PLX2W + 14 D). C57BL/6J mice were used. Iba1+ cells are shown as microglia. (b) Quantification of microglial density shown in (a). Microglia number was counted and normalized to area of the coronal section (mean ± SEM). Number of C57BL/6J mice (3 Mo) used: Ctrl (n = 3), PLX2W (n = 3), 7 D (n = 3), and 14 D (n = 4). One-way ANOVA with Dunnett's multiple comparisons test was used to compare with Ctrl group. (c) Schematic diagram of EdU labeling during microglia repopulation. Microglia were depleted in 3-month-old C57BL/6J mice using PLX5622 diet for 2 weeks. EdU was then administered via IP injection every 24 hours during 4 days of repopulation. (d) Quantification of cell density for EdU+/Iba1+ and EdU+/Iba1− cells (mean ± SEM) from different regions in day 4 repopulating brain. Number of C57BL/6J mice (3 Mo) used: n = 5. (e) Diagram showing the sub-brain regions used for quantification (see S2 Fig for representative images). (f) Confocal images showing Iba1+ microglia undergoing mitosis as marked by EdU labeling. (g–l) Confocal microscopy images showing costaining of Iba1, EdU, and a panel with different CNS markers in sections after 4 days of repopulation. EdU+Iba1− cells are highlighted with open arrow heads. EdU+Iba1− cells that are positive for CNS marker are marked by closed arrow heads. GFAP+, NeuN+, and DCX+ cells were imaged from the hippocampal region. Nestin+, S100β+, and Olig2+ cells were imaged from the thalamic region, shown as HPF and TH in panel (e), respectively. (m) Quantification of the percentage of EdU+Iba1− cells expressing different CNS markers out of all EdU+Iba1− cells in mice after 4 days of repopulation (mean ± SEM). Number of animal used: (n = 5). (n) Quantification of the percentage of Nestin-positive and Nestin-negative cells out of all EdU+Iba1+ cells. Number of animals used: (n = 5). P value is summarized as ns (P > 0.05), *(P ≤ 0.05), **(P ≤ 0.01), ***(P ≤ 0.001), and ****(P ≤ 0.0001). Individual numerical values can be found in S1 Data. CNS, central nervous system; Ctrl, control; CTX, cortex; D, days; DCX, doublecortin; EdU, 5-Ethynyl-2′-deoxyuridine; GFAP, glial fibrillary acidic protein; HY, hypothalamus; HPF, hippocampus; Iba1; IP, intraperitoneal; Mo, months; NeuN, neuronal nuclei; Olig2, oligodendrocyte transcription factor 2; PLX, PLX5622; TH, thalamus.

