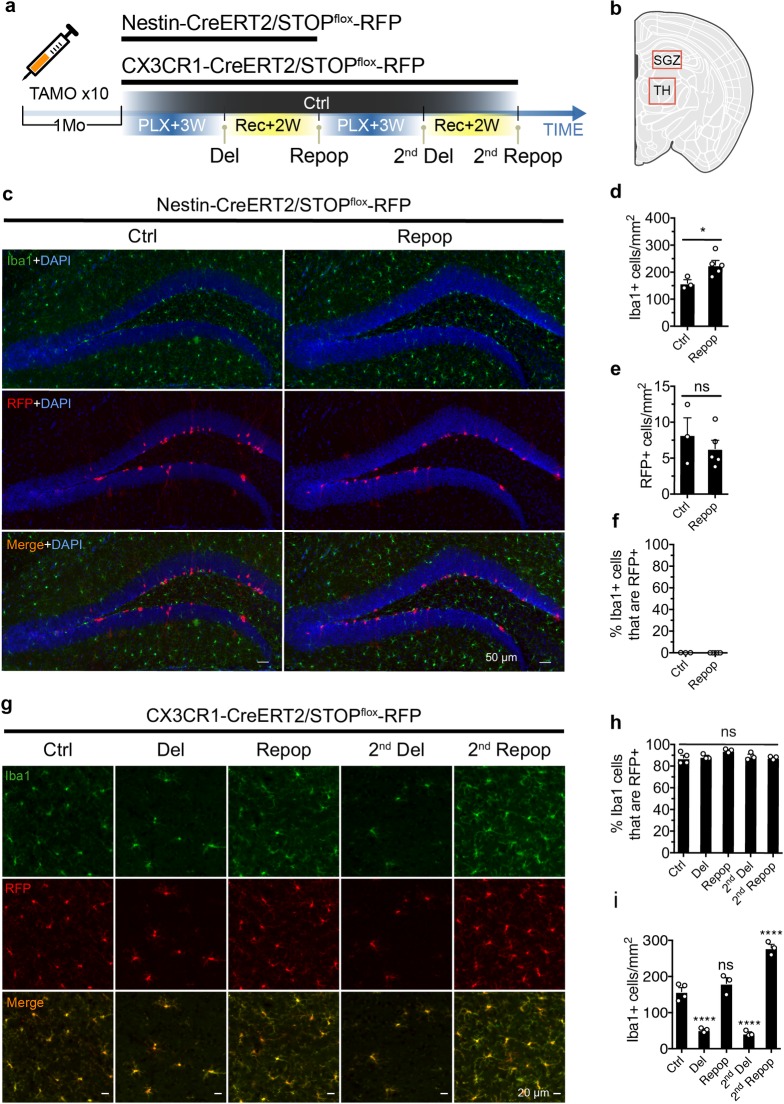
Fig 3. Repopulated microglia are exclusively derived from CX3CR1+ cell lineage.
(a) Schematic diagram of lineage tracing experiment for repopulated microglia. Nestin-CreERT2/STOPflox-RFP mice (4 Mo) or CX3CR1-CreERT2/STOPflox-RFP mice (7–9 Mo) were given 2 mg tamoxifen daily via IP injection for 10 days. Two weeks after the last tamoxifen administration, mice were subjected to 3 weeks of PLX treatment (Del) before switching back to normal diet for 2 weeks (Repop). This microglial depletion/repopulation regimen was repeated for a second round (2nd Del, 2nd Repop) for the CX3CR1-CreERT2/STOPflox-RFP mice. (b) Diagram showing the SGZ region and TH region used for imaging and quantification performed in the Nestin-CreERT2/STOPflox-RFP mice (c–f) and CX3CR1-CreERT2/STOPflox-RFP mice (g, i), respectively. (c) Representative images showing Nestin+ lineage (RFP+, red) and microglia (Iba1+, green) at the SGZ before and after microglial repopulation. Nestin-CreERT2/STOPflox-RFP mice (4 Mo) were treated as described in panel (a), with a single round of microglial depletion and repopulation. (d) Quantification of Iba1+ microglial cell density before and after repopulation (mean ± SEM). Number of animals used: Ctrl (n = 3) and Repop (n = 4). (e) Quantification of cell density of Nestin lineage (RFP+) before and after microglial repopulation (mean ± SEM). (f) Quantification of Iba1+ microglia that express Nestin before and after microglial repopulation (mean ± SEM). Unpaired t test was used to compute statistical differences (d, e). (g) Representative images showing Iba1+ (green) and RFP (red) after depletion and repopulation. Images were taken from the TH region. (h) Quantification of the percentage of Iba1+ microglia that express RFP (mean ± SEM). Numbers of animals used: Ctrl (n = 4), 1st Del (n = 3), 1st Repop (n = 3), 2nd Del (n = 3), and 2nd Repop (n = 3). One-way ANOVA was used to assess statistical differences among the groups. (i) Quantification of Iba1+ microglial density after different treatments (mean ± SEM). One-way ANOVA with Dunnett's multiple comparisons test was used by comparing to the Ctrl group. P value is summarized as ns (P > 0.05), *(P ≤ 0.05), **(P ≤ 0.01), ***(P ≤ 0.001), and ****(P ≤ 0.0001). Individual numerical values can be found in S1 Data. Ctrl, control; CreERT2, tamoxifen-inducible Cre recombinase; CX3CR1, CX3C chemokine receptor 1; Del, deletion; Iba1, ionized calcium binding adaptor molecule 1; IP, intraperitoneal; Mo, months; ns; PLX, PLX5622; Repop, repopulation; RFP, red fluorescent protein; SGZ, subgranular zone; TH, thalamus.

