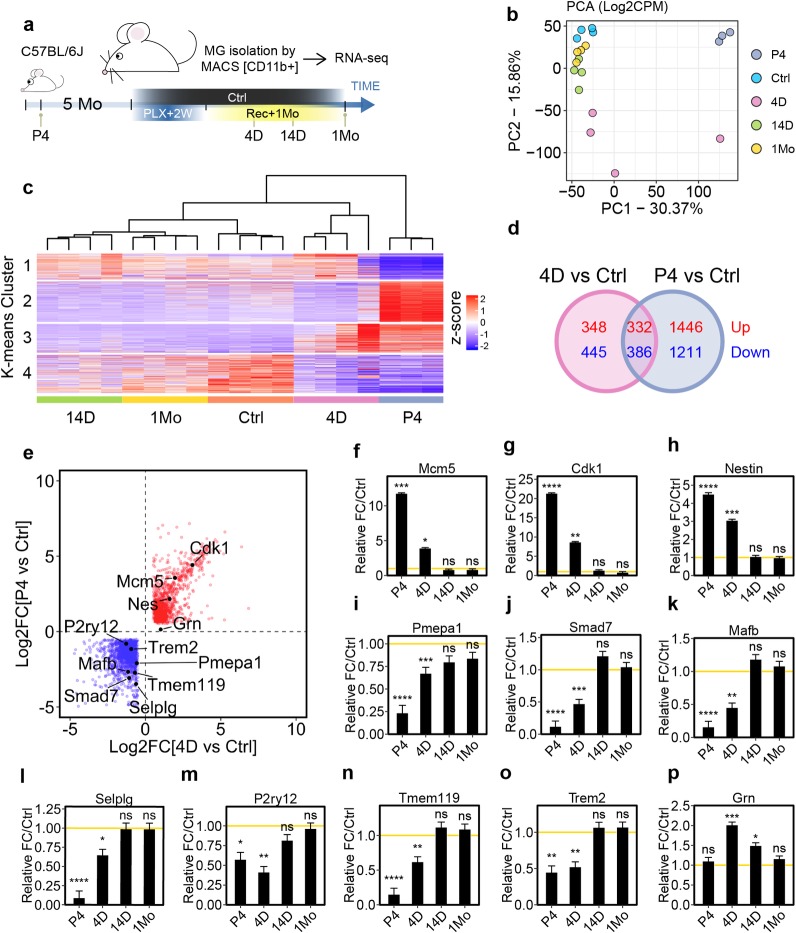
Fig 5. Adult newborn microglia progressively restore homeostatic maturity from a unique immature state.
(a) Schematic design for the RNA-seq experiment. C56BL/6 mice (5 Mo) were treated with 2 weeks of PLX5622 diet and switched to a normal diet for 4 days (4 D), 14 days (14 D), or 1 month (1 Mo). (b) PCA analysis of relative gene expression variance from control (Ctrl), P4 neonatal microglia (P4), and after 4 days (4 D), 14 days (14 D), and 1 month (1 Mo) of repopulation. The largest principle components, PC1 and PC2, were used to plot the data. (c) Heatmap showing k-means clustering (k = 4) for relative gene expression. Dendrogram indicates the hierarchical clustering of each biological replicates. Number of animals used: Ctrl (n = 4), 4 D (n = 4), 14 D (n = 4), 1 Mo (n = 4), and P4 (n = 3). (d) Venn diagram comparing differentially expressed genes between 4 D adult newborn microglia and P4 neonatal microglia. DE genes: Log2FC ≥ 1 or ≤ −1 and FDR < 0.05 in comparison to unperturbed adult microglia (Ctrl). Up-regulated genes and down-regulated genes are shown in red and blue, respectively. (e) Scatter plot showing DE genes shared by 4 D and P4 microglia. DE genes were calculated in comparison to Ctrl microglia with Log2FC ratio greater or less than 1 with FDR < 0.05. DE genes that are up-regulated in both 4D and P4 microglia are shown as red dots, while down-regulated genes are shown as blue dots. (f–p) Relative gene expression of Mcm5 (f), Cdk1 (g), Nestin (h), Pmepa1(i), Smad7 (j), Mafb (k), Selplg (l), P2ry12 (m), Tmem119 (n), Trem2 (o), and Grn (p). Relative fold change was calculated in comparison to untreated control microglia. The yellow lines (y = 1) indicate normalized baseline expression of control. FDR is summarized as ns (P > 0.05), *(P ≤ 0.05), **(P ≤ 0.01), ***(P ≤ 0.001), and ****(P ≤ 0.0001). Individual numerical values can be found in S1 Data. Ctrl, control; D, days; DE, differentially expressed; FDR, false discovery rate; Log2FC, log2 transformed fold change; Mo, months; PCA, principal component analysis; PLX, PLX5622.

