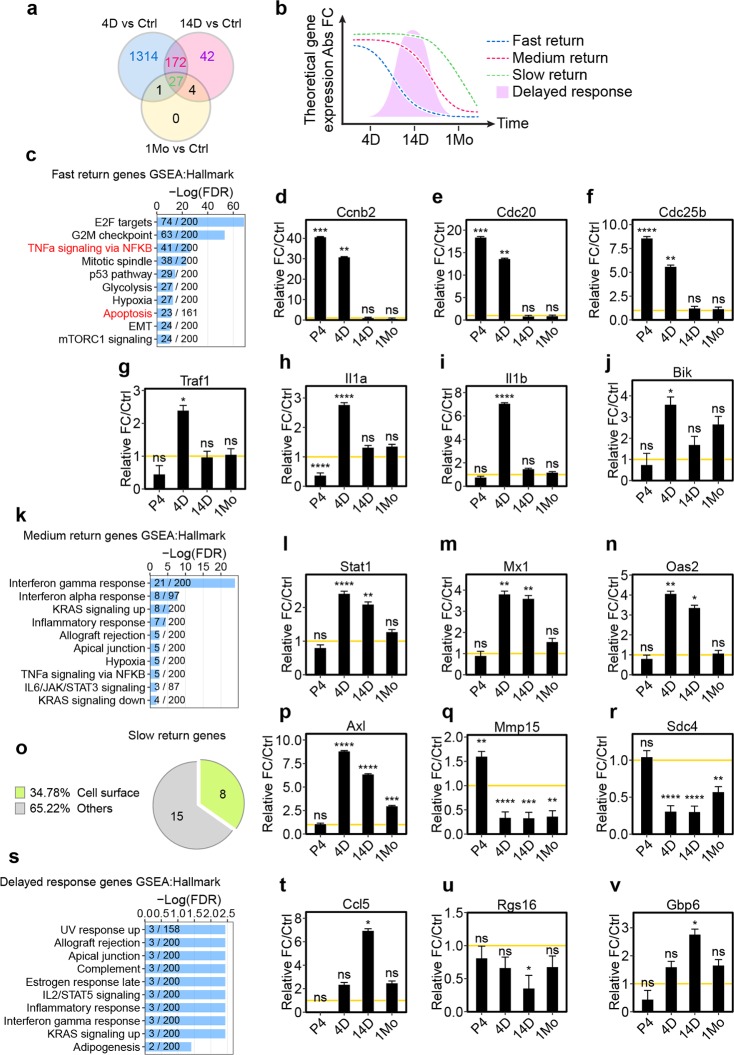
Fig 6. Adult newborn microglia engage a stepwise program to restore their steady-state gene signature.
(a) Venn diagram comparing DE genes among 4 D, 14 D, and 1 Mo adult newborn microglia. DE genes were calculated in comparison to Ctrl microglia with Log2FC ratio greater or less than 1 with FDR < 0.05. (b) Schematic diagram illustrating gene sets with differential rates of homeostatic return. (c) GSEA analysis of fast-return genes using the hallmark gene set. The top 10 most-enriched pathways are shown. The number of genes identified in the RNA-seq is shown as numerator. The number of total genes curated for the specific term is shown as denominator. (d–j) Relative gene expression of Cdcnb2 (d), Cdc20 (e), Cdc25b (f), Traf1 (g), Il1a (h), Il1b (i), and Bik (j). (k) GSEA analysis on medium-return genes using the hallmark gene set. (l–n) Relative gene expression of Stat1 (l), Mx1 (m), and Oas2 (n). (o) GO (cellular component) analysis on slow-return genes. (p–r) Relative gene expression of Axl (p), Mmp15 (q), and Sdc4 (r). (s) GSEA analysis on “delayed response” genes using the hallmark gene set database. (t–v) Relative gene expression of Ccl5 (t), Rgs16 (u), and Gbp6 (v). For all gene expression graphs, relative fold change was calculated in comparison to untreated Ctrl microglia. Yellow lines (y = 1) indicate normalized baseline expression of control. FDR is summarized as ns (P > 0.05), *(P ≤ 0.05), **(P ≤ 0.01), ***(P ≤ 0.001), and ****(P ≤ 0.0001). Individual numerical values can be found in S1 Data. Ctrl, control; DE, differentially expressed; FDR, false discovery rate; GO, gene ontology; GSEA, gene set enrichment analysis; Log2FC, log2 transformed fold-change.

