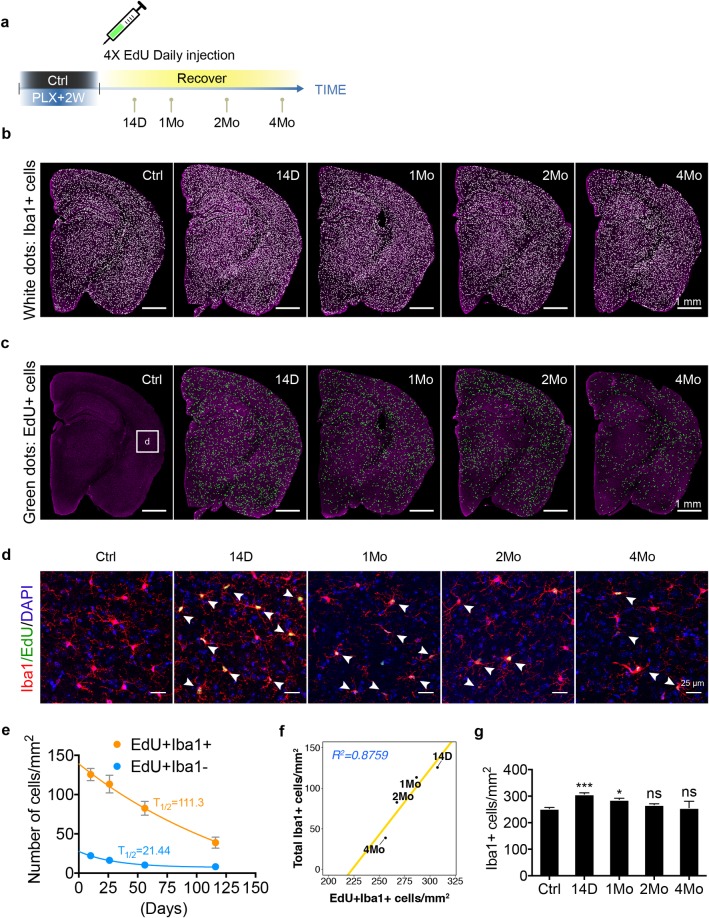
Fig 9. Homeostasis of adult newborn microglia is re-established through steady turnover.
(a) EdU pulse-chase experiment to determine the longevity of newborn microglia. C57BL/6J mice (3–5 Mo) were treated with PLX5622 diet for 2 weeks and switched to a normal diet. EdU was injected via IP every 24 hours during the first 4 days of repopulation. Mice were analyzed after repopulation of 14 D, 1 Mo, 2 Mo, and 4 Mo. (b) Stitched coronal section showing microglia density. Iba1+ cells are visualized by white dots. (c) Stitched coronal section showing the density of EdU+ cells. EdU+ cells are visualized by green dots. (d) Zoomed in images from the cortical region (box “d” in panel c) showing colocalization of Iba1+ microglia (red) and EdU (green). Iba1+EdU+ cells are highlighted with white arrowheads. (e) Number of EdU+Iba1+ cells (orange line) and EdU+Iba1− cells (blue line) over time is fitted with nonlinear model: 1-phase exponential decay. Cell density (mean ± SEM) was quantified using the entire coronal area, as shown in panel c. T1/2 indicates half-life (days) for each population. Animals used: 14 D (n = 4), 1 Mo (n = 6), 2 Mo (n = 6), and 4 Mo (n = 3). (f) Linear regression showing the correlation between the decay of EdU+Iba1+ cells (x-axis) and the decay of total microglial cells (y-axis). R2 = 0.8579. (g) Quantification of Iba1+ microglial density using entire coronal area as shown in panel (b) (mean ± SEM). Animals used: 14 D (n = 4), 1 Mo (n = 6), 2 Mo (n = 6), and 4 Mo (n = 3). One-way ANOVA with Dunnett's multiple comparisons test was used by comparing to the Ctrl group. P value is summarized as ns (P > 0.05), *(P ≤ 0.05), **(P ≤ 0.01), ***(P ≤ 0.001), and ****(P ≤ 0.0001). Individual numerical values can be found in S1 Data. Ctrl, control; D, days; EdU, 5-Ethynyl-2′-deoxyuridine; Iba1, ionized calcium binding adaptor molecule 1; IP, intraperitoneal; Mo, months; PLX, PLX5622.

