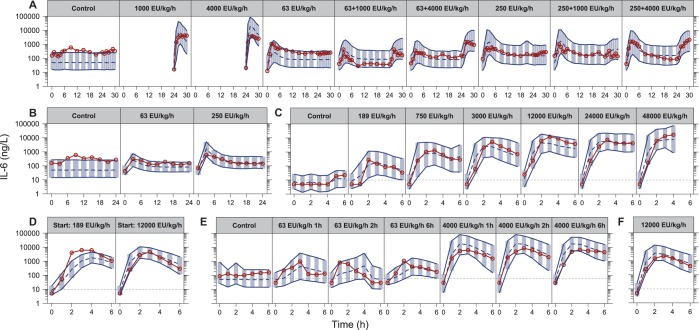
Fig 4. Visual predictive checks for interleukin-6 based on the final model, stratified by study and infusion rate or design (studies A-F in Table 1), with the endotoxin infusion rate indicated for each panel.
The red solid lines and circles correspond to the median observed concentration, while the dashed line correspond to the median simulated concentration. The shaded area between the two solid lines correspond to the 95% confidence interval for the median simulation. The dashed horizontal lines corresponds to the assay lower limit of quantification, with observations below set to half of this limit for illustration.

