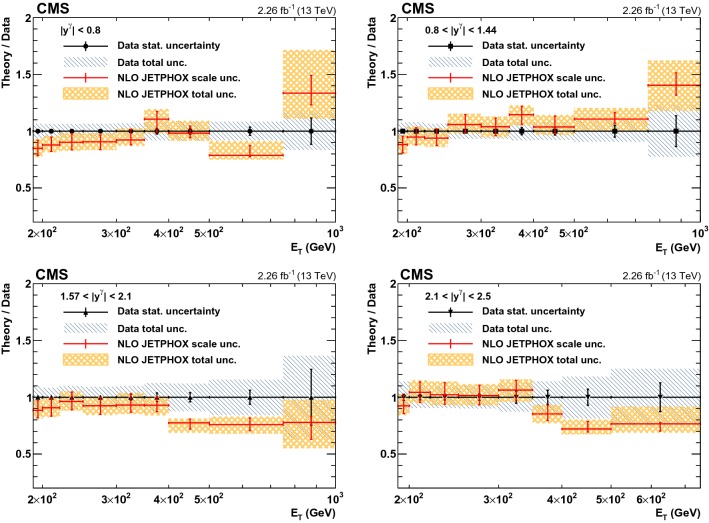
Fig. 4.
The ratios of theoretical NLO predictions to data for the differential cross sections for isolated-photon production in four photon rapidity bins, , , , and , are shown. The error bars on data points represent the statistical uncertainty, while the hatched area shows the total experimental uncertainty. The errors on the ratio represent scale uncertainties, and the shaded regions represent the total theoretical uncertainties

