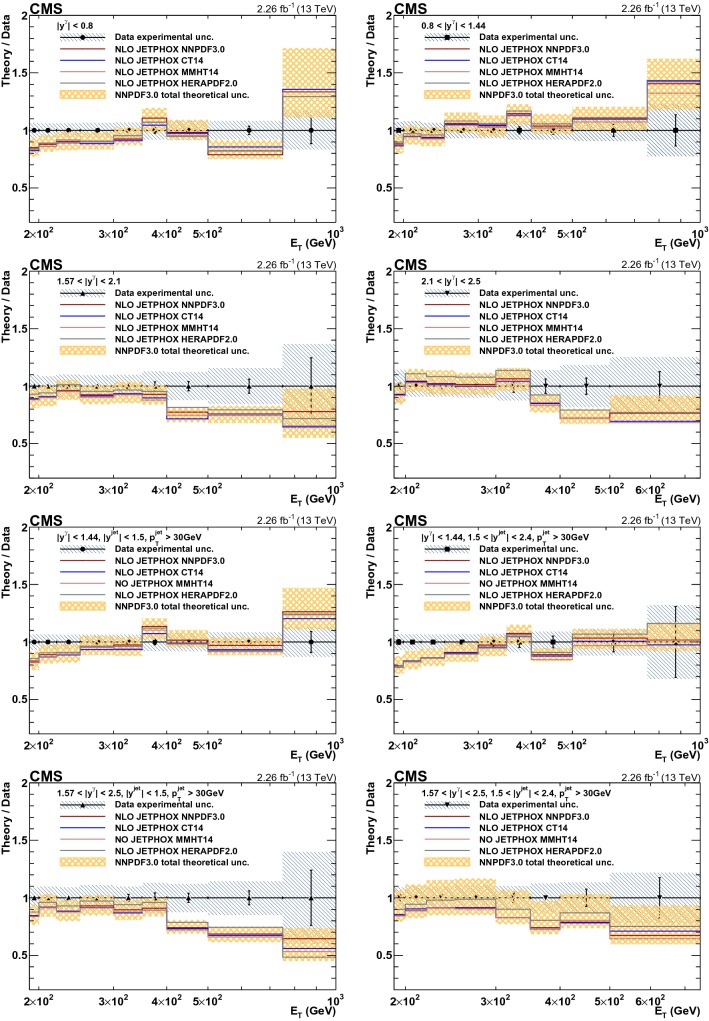
Fig. 7.
Ratios of jetphox NLO predictions to data for various PDF sets as a function of photon for inclusive isolated-photons (top four panels) and photon+jet (four bottom panels). Data are shown as points, the error bars represent statistical uncertainties, while the hatched area represents the total experimental uncertainties. The theoretical uncertainty in the NNPDF3.0 prediction is shown as a shaded area

