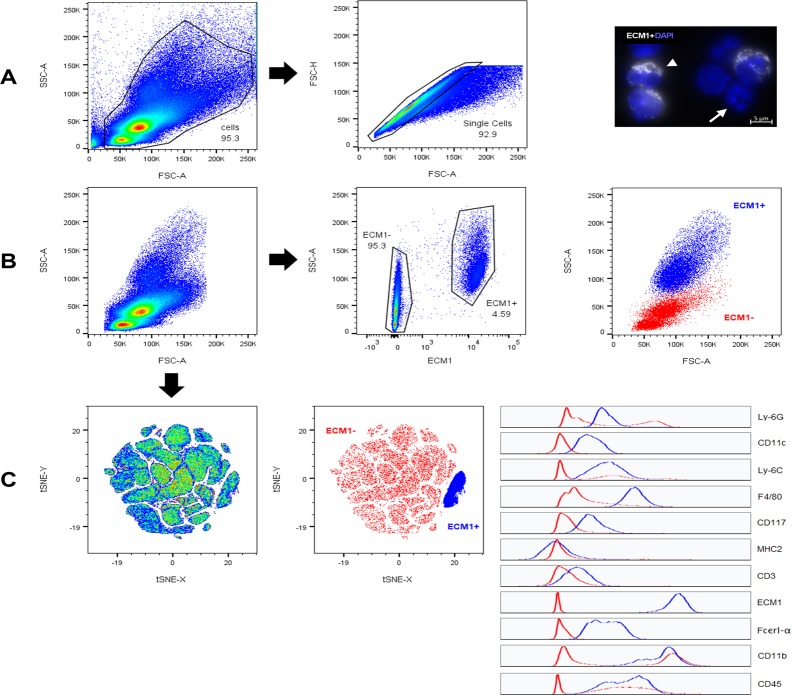
Fig 3. ECM1 FISH-Flow cytometry.
ECM1 mRNA-FISH was coupled with flow cytometry to identify the cell surface marker profile of ECM1 positive (ECM1+) cells in young healthy mouse bone marrow. A) Forward scatter area (FSC-A; x-axis) versus side scatter area (SSC-A; y-axis) pseudocolour plot, demonstrating the gating strategy used to define our “cells” population, in order to exclude debris; left graph. Forward scatter area (FSC-A; x-axis) versus forward scatter height (FSC-H; y-axis) pseudocolour plot, demonstrating the gating strategy used to define “single cells” population, in order to exclude cell doublets; middle graph. An image of mRNA-FISH of Ecm1 mRNA (white), conducted on BMCs in suspension; DAPI nuclear stain was used to visualize cell nuclei (Blue); right image. B) FSC-A versus SSC-A pseudocolour plot of the defined “single cells” population (left graph), and ECM1 (APC area channel) versus SSC-A pseudocolour plot demonstrating the gating strategy used to define ECM1 positive (ECM1+) and ECM1 negative (ECM1-) cells (middle graph). Included is FSC-A versus SSC-A of the ECM1+ gate overlayed onto the “single cells” population. C) A pseudocolour plot of cell population clusters after tSNE analysis conducted on the concatenated sample containing the gated populations from all four biological replicate samples combined (left graph; presented as tSNE x-axis versus tSNE y-axis). All compensated channels were assessed: FITC (Ly-6G), PerCP-Cy5.5 (CD11c), BV421 (Ly6C), BV510 (F4/80), BV650 (CD117), BV711 (MHC2), BV786 (CD3), APC (ECM1), PE (FcεRI-α), PE-CF594 (CD11b), and PE-Cy7 (CD45). Gates corresponding to ECM1+ (blue) and ECM- (red) cells from the concatenated sample was overlayed onto the tSNE pseudocolour graph (middle graph) to visualise expression levels of all cell surface markers investigated, as represented by the corresponding histograms (right graph); x-axis corresponds to expression level, y-axis corresponds to cells number.

