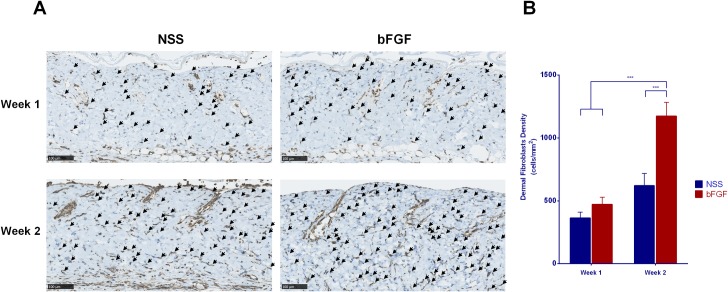
Fig 3. The infiltration of recipient fibroblasts into inactivated dermis after implantation.
(A) Micrographs of anti-vimentin-stained sections differentiating fibroblasts from other cells at Weeks 1 and 2 after implantation. Recipient fibroblasts began to infiltrate the grafts at Week 1 and increased at Week 2. ↙: fibroblast; magnification: 20x, scale bar: 100 μm. (B) A comparison of the dermal fibroblast density of the grafts; a significant increase in the number of fibroblasts in the bFGF group was noted between Weeks 1 and 2 as well as between the bFGF and NSS groups in Week 2 (*** p < 0.001).

