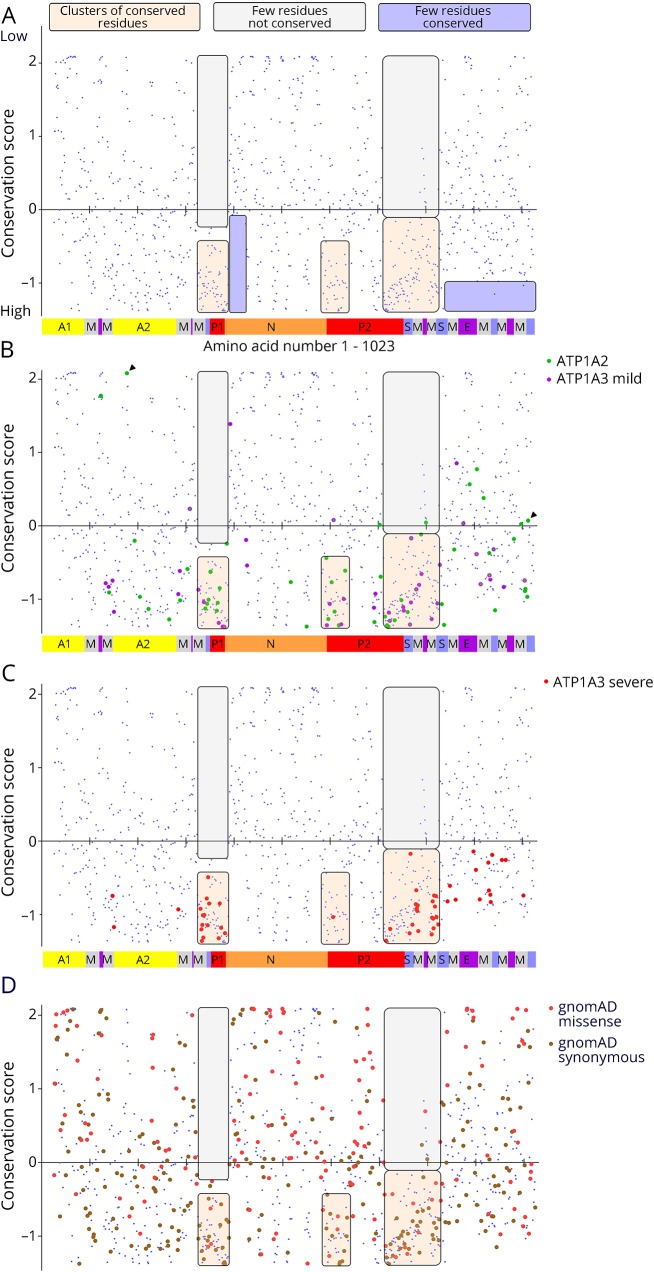
Figure 5. Evolutionary sequence conservation.
Human ATP1A1, ATP1A2, and ATP1A3 amino acid sequences were aligned with Sus scrofa ATP1A1 (the species used in protein crystal structures 3KDP and 3WGU), and each residue affected by a disease variant was assigned the conservation score calculated for ATP1A1. (A) The individual conservation scores of all aligning amino acids are shown with score on the Y axis and amino acid sequence (1–1,023) on the X axis. As seen in figure e-1 (links.lww.com/NXG/A134), there is no alignment at the N-terminus, so N-terminal residues do not appear. Each blue spot is one amino acid, and the Na,K-ATPase domains are illustrated in the bar at the bottom. Some patterns of conservation can be discerned, highlighted by transparent boxes: two regions with few or no highly conserved amino acids (lavender) and 3 regions of conserved residues (tan) with practically no low conservation residues (off-white). (B) The ATP1A2 variants (green) and the mild ATP1A3 variants (magenta) have similar distributions. There are 14 cases (∼15%) where homology scores were in the less-conserved half. The C-terminal region has many pathogenic variants in both genes despite lacking the highest conservation scores. Residues E174 and R1008 from figure 6 are marked with arrowheads. (C) The severe ATP1A3 variants had a more restricted distribution. It can be seen that many align with the membrane spans. Although their conservation scores varied widely, none were in the less-conserved half. Of the points that do not lie in one of the 3 clusters of high conservation, 8 were shared by mild and severe ATP1A3 phenotypes (visible as 2 colors per symbol at high magnification). This suggests that intermediate phenotypes tend to have less restricted structure distributions than the most severe phenotypes. (D) All the synonymous (brown; n = 281) and missense (coral pink; n = 145) ATP1A3 variants from gnomAD (138,632 sequences) are plotted to compare to the clustering of mutations.

