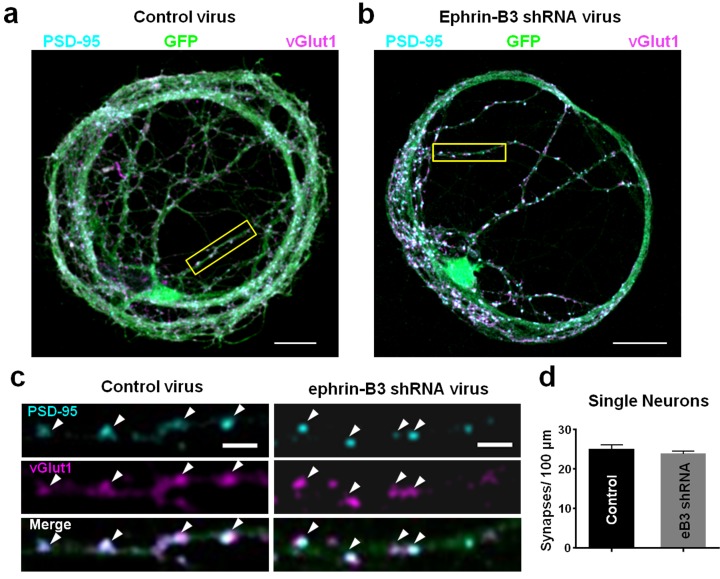
Figure 1. Knockdown of ephrin-B3 does not alter synapse density in single-neuron microislands.
(a and b) Representative images of dendrites from single-neuron microislands transduced with control (pSuper) and eB3 shRNA viruses and immunostained at DIV21 for vGlut1 and PSD-95. Scale bar, 20 μm. (c) Higher magnification images of boxed regions shown in a and b. Arrowheads indicate colocalized vGlut1 and PSD-95 puncta. Scale bar, 5 μm. (d) Quantification of synapse density in single neuron microislands (Control, n=27; eB3 shRNA, n=47; t(72)=0.9390, p=0.3509, two-tailed Student’s t-test) transduced with the indicated viruses.


