. 2019 Feb 21;8:e41563. doi: 10.7554/eLife.41563

Figure 5. Efnb3 is expressed in CTIP2 +projection neurons.

(a) Representative cells within WT mouse cortex labeled by RNAscope ISH for CTIP2 mRNA (Bcl11b), SATB2 mRNA (Satb2), and eB3 mRNA (Efnb3). Scale bar, 3 μm. (b) Quantification of the number of RNAscope ISH eB3 puncta per cell across the indicated cell types (CTIP2+, n = 72; CTIP2+/SATB2+, n = 69; SATB2+, n = 93; F (2, 231)=9.332, p=0.0001, one-way ANOVA, ***p=0.0004, **p=0.0026 *, Tukey’s post hoc.) (c) Representative image of a tdTomato+/CTIP2 +cell in MADM cortex co-labeled with CTIP2 and SATB2 antibodies. Scale bar, 10 μm. (d) Analysis of apical dendrite width in subgranular neurons expressing CTIP2 and/or SATB2. Most neurons expressing CTIP2 have large (>1.6 μm) dendrites.

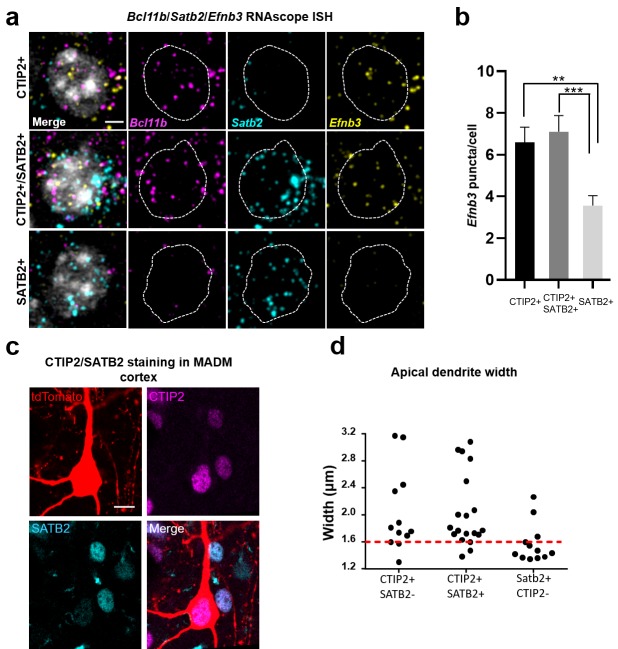
Figure 5—source data 1. Efnb3 is expressed in CTIP2 +projection neurons.
DOI: 10.7554/eLife.41563.016

Figure 5.

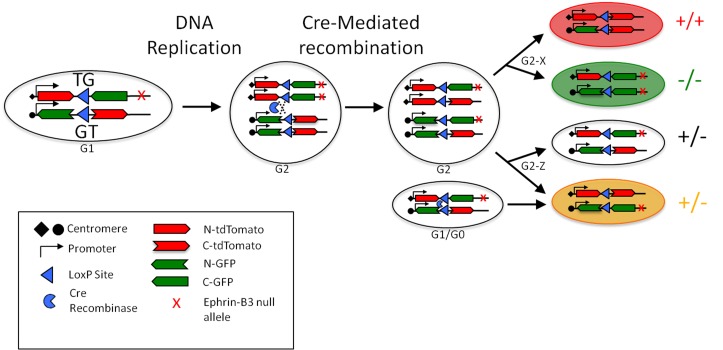
Figure 5—figure supplement 1. Schematic of recombination in eB3 MADM mice.

Figure 5—figure supplement 1.

(a) Interchromosomal recombination in eB3 MADM mice generates fluorescently labeled cells of known eB3 genotype. Cre-mediated recombination in G2 phase followed by segregation of chromatids into daughter cells generates a wild-type (tdTomato+) and an eB3 null (EGFP+) cell (G2-X segregation), or one unlabeled and one double-labeled cell with unaltered genotype (G2-Z segregation). Recombination in G1 or G0 phase results in a double-labeled cell with unaltered genotype. Adapted from Espinosa et al., 2009.
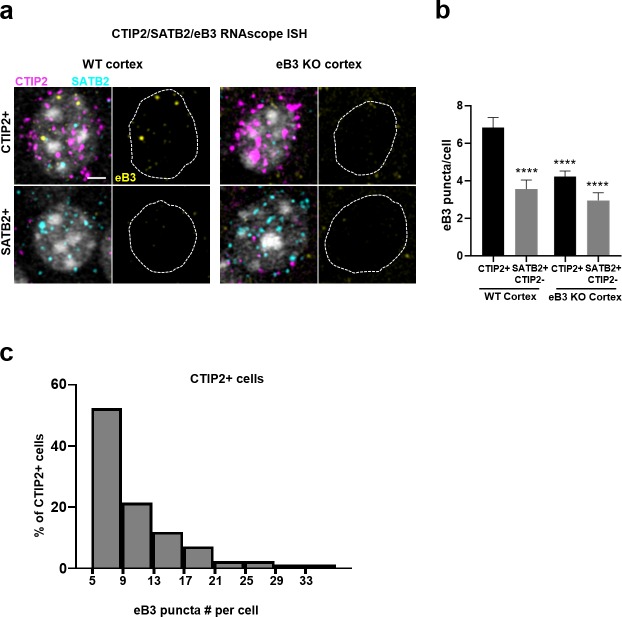
Figure 5—figure supplement 2. Controls for RNAscope ISH.

Figure 5—figure supplement 2.

(a) Representative three color RNAscope ISH images from WT and Efnb3-/- mouse cortex, showing reduced eB3 probe signal in CTIP2 + cells (CTIP2 + and CTIP2+/SATB2 + included) within Efnb3-/- cortex. Scale bar, 3 µm. (b) Quantification of Efnb3 expression in the indicated cell types in WT and Efnb3-/- cortex (WT CTIP2+, n = 141; WT SATB2+, n = 93; KO CTIP2+, n = 236; KO SATB2+, n = 86 F (3, 552)=14.39, p<0.0001, one-way ANOVA, ****p<0.0001, Tukey’s post hoc). (c) Distribution of Efnb3 puncta numbers in CTIP2 + cells (N = 84, bin size = 4). Cells with less than five puncta were excluded.
Figure 5—figure supplement 2—source data 1. Controls for RNAscope ISH.
DOI: 10.7554/eLife.41563.020