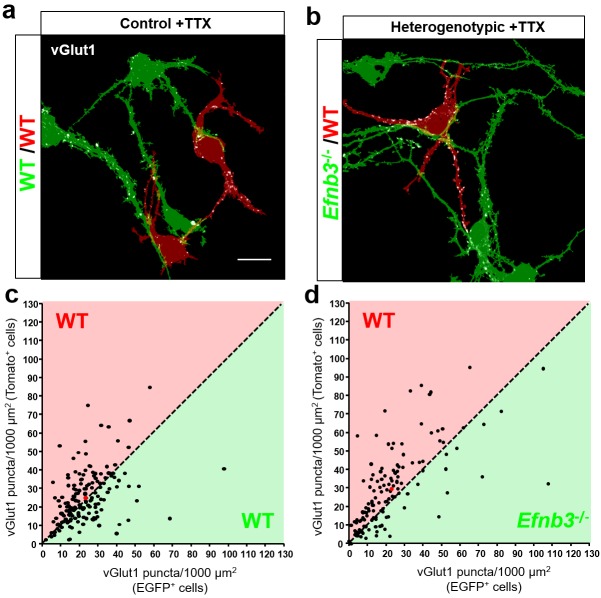
Figure 9. Control of synapse number by ephrin-B3 does not require activity.
(a and b) Representative image fields and corresponding masks used for analysis from control (a) and heterogenotypic (b) DIV11 MADM cultures treated with TTX (1 μm) from DIV3-11. Scale bar, 20 μm. (c and d) Scatter plots in which each point represents the density of vGlut1 + synapses contacting tdTomato+ (y axis) and EGFP+ (x axis) neurons in a single image field. The red point in each graph represents the average of all data points. The proportion of fields in which tdTomato + neurons received a higher fraction of local synaptic contacts than EGFP + neurons is significantly higher in heterogenotypic cultures than control cultures (control, n = 166 fields; heterogenotypic, n = 135 fields; p=0.0036, Fisher’s exact test).

