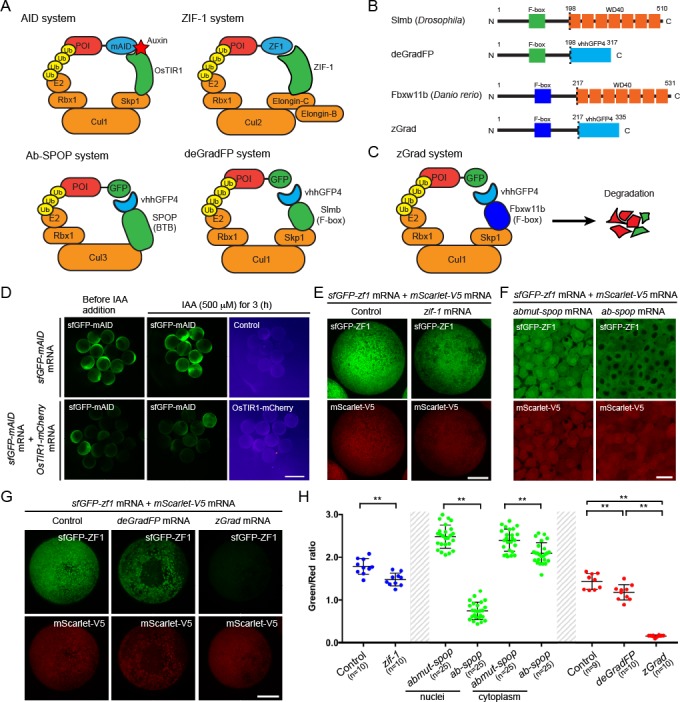
Figure 1. zGrad degrades GFP-tagged proteins in zebrafish.
(A) Overview of degron-based protein degradation systems. POI: protein of interest. (B) Comparison of deGradFP and zGrad fusion proteins. (C) Schematic of zGrad-mediated target protein degradation. (D) Representative images of embryos injected with sfGFP-mAID mRNA (210 pg) only (top) or with sfGFP-mAID mRNA (210 pg) and OsTIR1-mCherry mRNA (42 pg) (bottom) before (left, 8 hpf) and after IAA (500 µM) induction for 3 hr (middle and right, 11 hpf). Red channel is shown as a fire map (right). Scale bar: 1 mm. (E) Representative images of embryos injected with sfGFP-ZF1 mRNA and mScarlet-V5 mRNA only (left) or with sfGFP-ZF1 mRNA and mScarlet-V5 mRNA and zif-1 mRNA (right) at 9 hpf. Scale bar: 200 µm. Note that mScarlet-V5 fluorescence served as an internal control. (F) Single-plane confocal images of cells in embryos injected with sfGFP-ZF1 mRNA, mScarlet-V5 mRNA and abmut-spop mRNA (left) or ab-spop mRNA (right) at 9 hpf. Scale bar: 20 µm. (G) Representative images of embryos injected with sfGFP-ZF1 mRNA and mScarlet-V5 mRNA (left) or with sfGFP-ZF1 mRNA and mScarlet-V5 mRNA and deGradFP mRNA (middle) or zGrad mRNA (right) at 9 hpf. Scale bar: 200 µm. (H) Quantification of control and Zif-1-mediated sfGFP-ZF1 degradation shown in E (blue), Abmut-SPOP control and Ab-SPOP-mediated sfGFP-ZF1 degradation shown in F (green), and deGradFP-mediated and zGrad-mediated sfGFP-ZF1 degradation shown in G (red). Mean, SD and n are indicated. **p<0.01. .

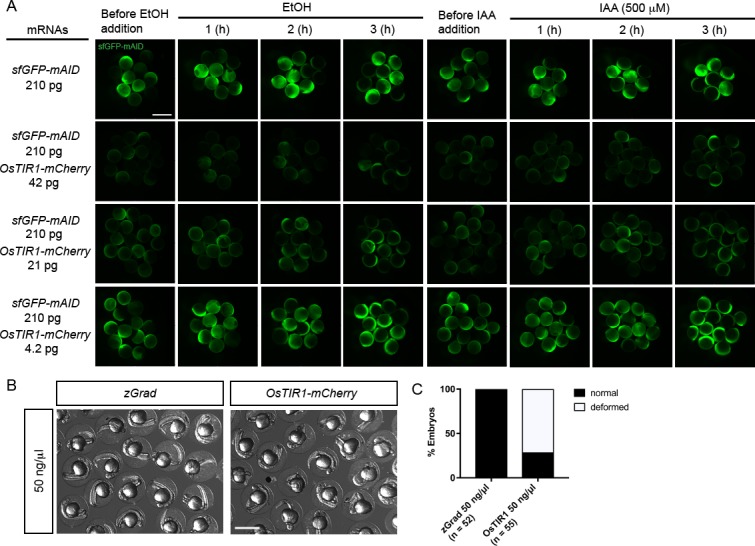
Figure 1—figure supplement 1. Characterization of the AID system in zebrafish.

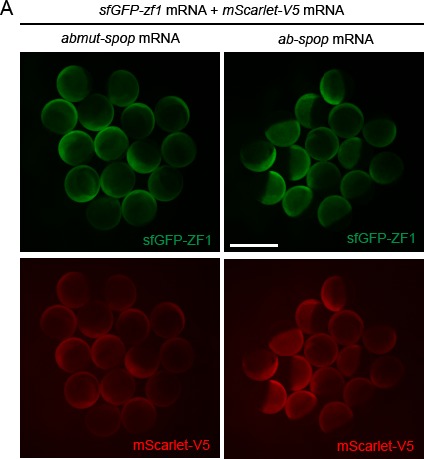
Figure 1—figure supplement 2. Characterization of the Ab-SPOP system in zebrafish.

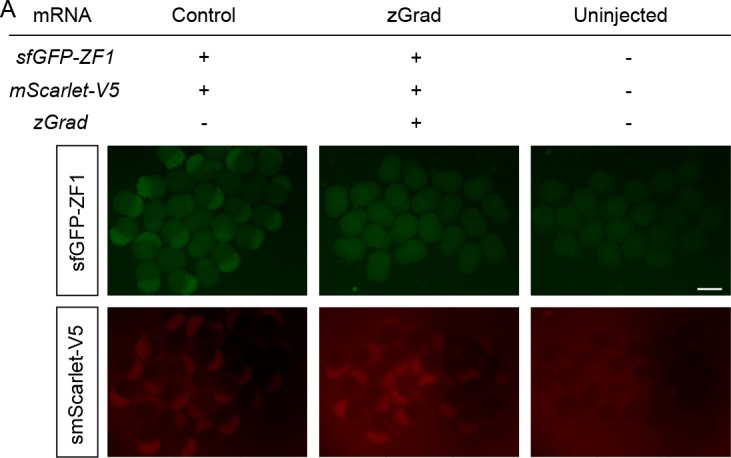
Figure 1—figure supplement 3. Onset of zGrad-mediated sfGFP-ZF1 degradation in early embryos.

