. 2019 Jan 29;8:e40970. doi: 10.7554/eLife.40970

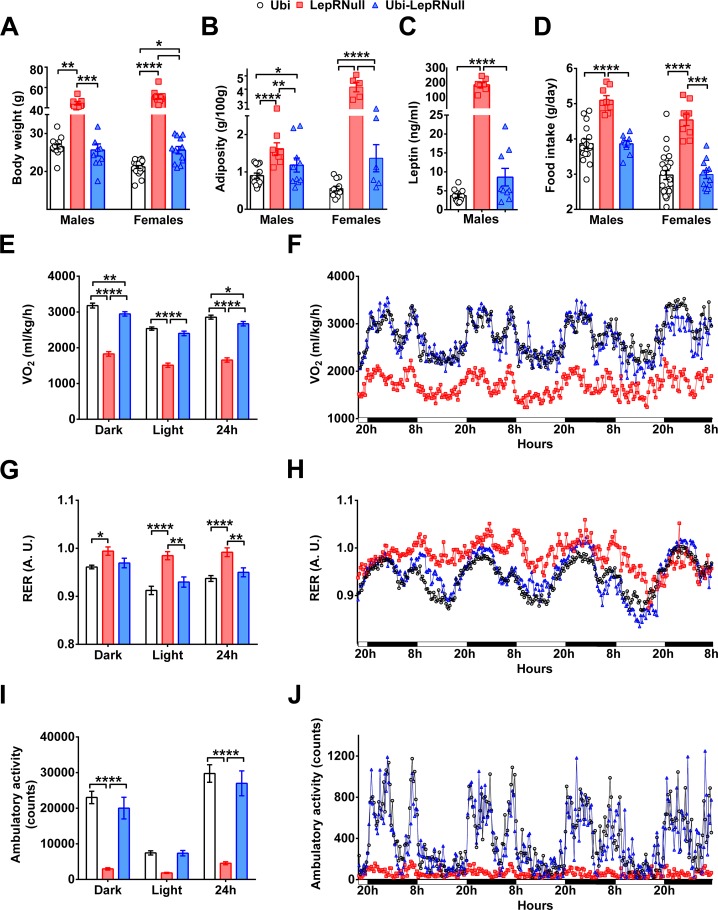
Figure 5. LepR reactivation before the onset of obesity confirmed the energy imbalance of Ubi-LepRNull mice.

(A–D) Body weight (males, n = 7–16; females, n = 10–24), perigonal fat pad (males, n = 8–16; females, n = 5–12), serum leptin concentration (males, n = 8–12) and food intake (males, n = 8–16; females, n = 5–12) in mice treated with tamoxifen at 4 weeks of age. (E–F) Energy expenditure (VO2) during dark phase, light phase and 24 hr in male mice (n = 8–16). (G–H) Respiratory exchange ratio (RER) in male mice (n = 8–16). (I–J) Voluntary ambulatory activity in male mice (n = 8–16). *p<0.05; **p<0.01; ***p<0.001; ****p<0.0001 (Figure 5—source data 1).

Figure 5—source data 1. Data regarding energy balance in young mice.
elife-40970-fig5-data1.xlsx (209.6KB, xlsx)
DOI: 10.7554/eLife.40970.023

Figure 5.

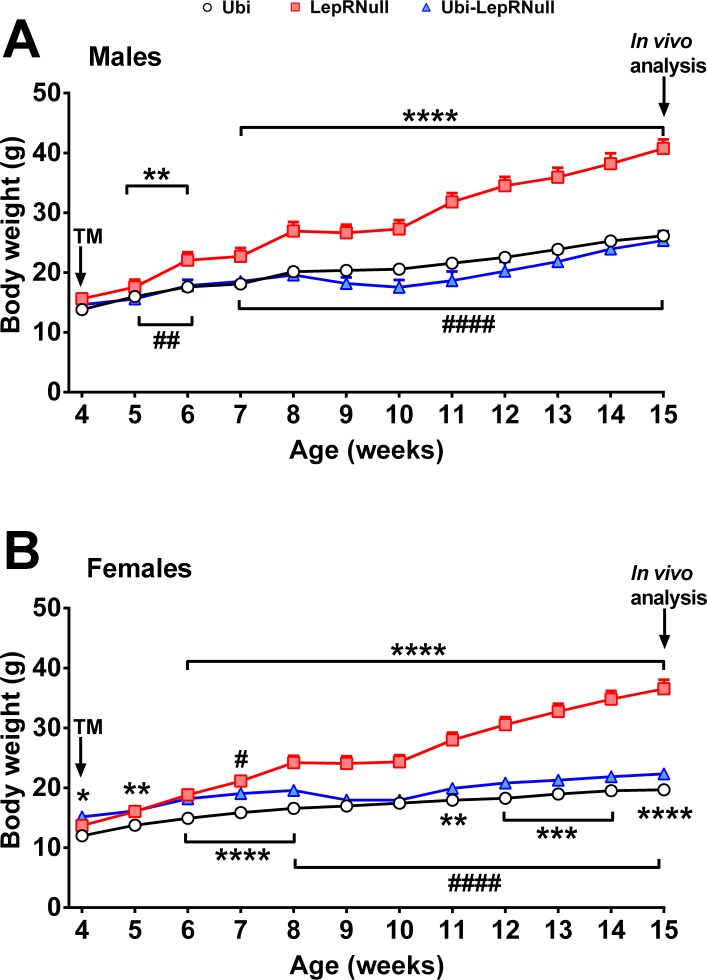
Figure 5—figure supplement 1. LepR reactivation before the onset of obesity in male and female mice.

Figure 5—figure supplement 1.

(A) Body weight changes in male mice treated with tamoxifen at 4 weeks of age (main effect of Genotype [F(2, 29)=24.34, p<0.0001], main effect of Time [F(11, 319)=367.4, p<0.0001] and interaction [F(22, 319)=33.06, p<0.0001]; n = 6–16). TM, indicates the beginning of tamoxifen treatment. Note that the in vivo analyses were performed only when mice completed 15 weeks of life. (B) Body weight changes in female mice treated with tamoxifen at 4 weeks of age (main effect of Genotype [F(2, 42)=92.37, p<0.0001], main effect of Time [F(11, 462)=534.1, p<0.0001] and interaction [F(22, 462)=88.29, p<0.0001]; n = 9–24). *p<0.05 vs Ubi group; **p<0.01 vs Ubi group; ***p<0.001 vs Ubi group; ****p<0.0001 vs Ubi group. # p<0.05 vs LepRNull group; ## p<0.01 vs LepRNull group; #### p<0.0001 vs LepRNull group (Figure 5—figure supplement 1—source data 1).
Figure 5—figure supplement 1—source data 1. Data regarding leptin receptor reactivation in young mice.
DOI: 10.7554/eLife.40970.020
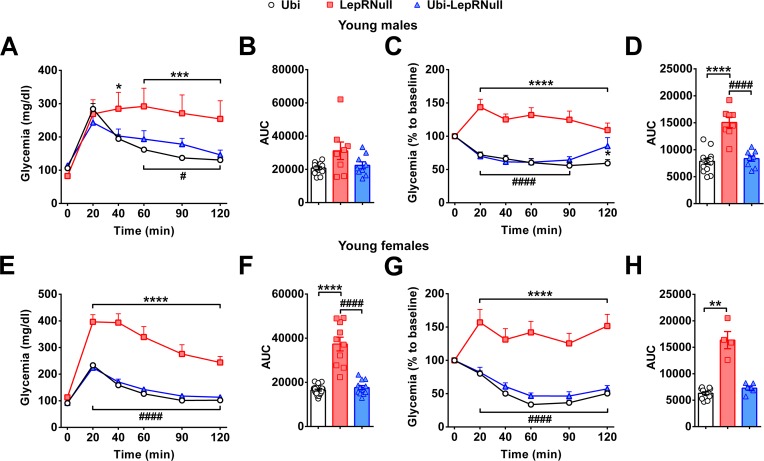
Figure 5—figure supplement 2. LepR reactivation before the onset of obesity completely normalized the glucose tolerance and insulin sensitivity.

Figure 5—figure supplement 2.

(A–B) Glucose tolerance test (GTT; 2 g glucose/kg b.w.; i.p.) and the area under the curve (AUC) of the GTT in male mice treated with tamoxifen at 4 weeks of age (n = 8–16). (C–D) Insulin tolerance test (ITT; 1 IU/kg b.w.; i.p.) and the AUC of the ITT in male mice treated with tamoxifen at 4 weeks of age (n = 8–16). (E–F) GTT and the AUC of the GTT in female mice (n = 10–24). (G–H) ITT and the AUC of the ITT in female mice (n = 10–24). *p<0.05 vs Ubi group; **p<0.01 vs Ubi group; ***p<0.001 vs Ubi group; ****p<0.0001 vs Ubi group. # p<0.05 vs LepRNull group; #### p<0.0001 vs LepRNull group (Figure 5—figure supplement 2—source data 1).
Figure 5—figure supplement 2—source data 1. Data regarding glucose homeostasis in young mice.
DOI: 10.7554/eLife.40970.022