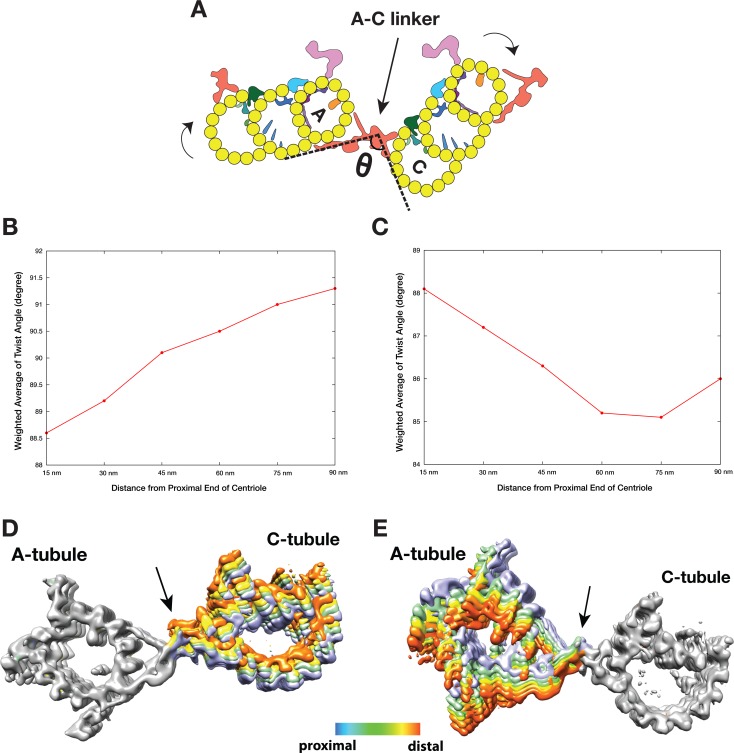
Figure 4. The Twist of A-C Linker Drives Procentriole Triplets in Iris Diaphragm Motion.
(A) Schematic diagram of two triplets connected by the A-C linker. θ is defined as the angle between the Arm A and the Leg B. The results of mapping and angle measurement as shown in (B-C, Table 2) are consistent with a twisting motion of two triplets as indicated by two curved arrows when moving longitudinally from proximal to distal direction. The pivot point of this twist is at the A-C linker as indicated by an arrow. (B and C) Weighted averages of twist angle along the triplet wall in two classification schemes shown in Figure 3—figure supplements 1,4. Six points along 90 nm longitudinal length of centriole are sampled starting from the proximal end. The weighted average of twist angle T at point i is defined as: Ti = ∑ θj*Nij / ∑ Nij . Nij: number of subtomogram belong to class j at point i. θj: twist angle as defined in (A) for class j. (D and E) Overlay of two sets A-C linker structure based on two classification schemes (Figure 3—figure supplements 1,4). Based on its longitudinal position, each structure is colored following a ‘heat map’ scheme. Arrows point to the pivot point, the central trunk.

