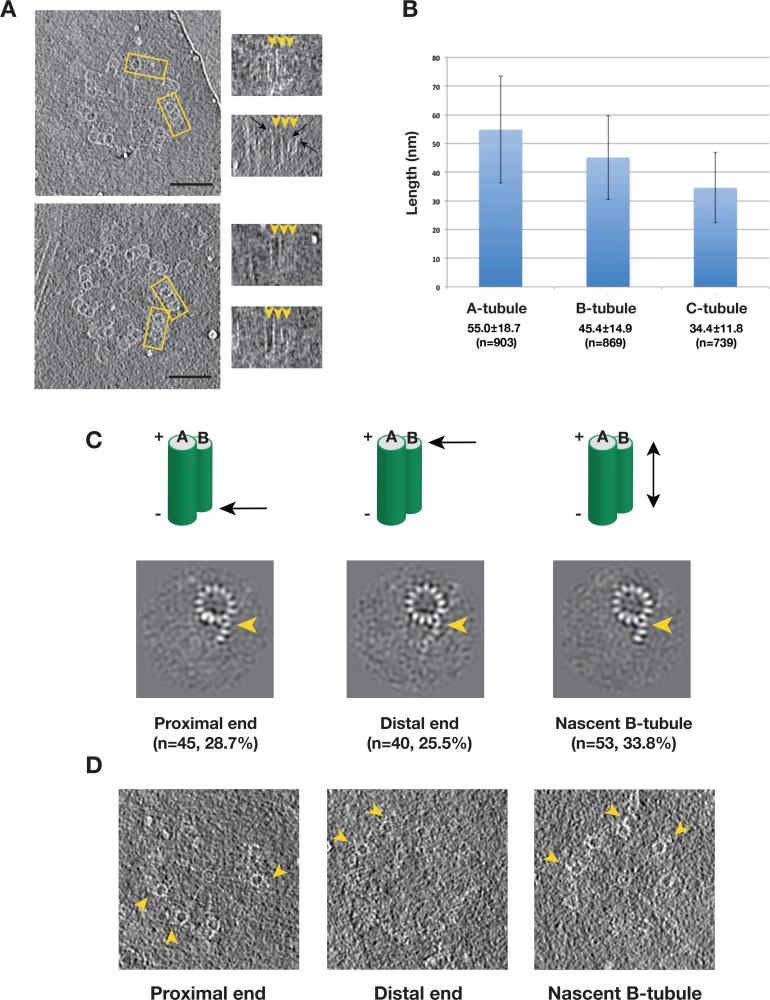
Figure 5. Variation of the Tubule Length in Procentriole Triplets and Detecting the B-tubule Intermediate.
(A) Two examples of procentriole in tomogram. In each, two triplets marked by yellow rectangle box are selected to depict tubule length variation as shown on the right in the longitudinal view. The distal end of each tubule is indicated by an arrowhead. Black arrows indicate examples of the slightly flared morphology at the growing end of the tubule. Scale bar: 100 nm. (B) Histogram showing length distribution for A-, B- and C-tubules. For each tubule, the average length, its standard deviation and the number of measurement are indicated. (C) The averages of incomplete B-tubule from the proximal, distal and nascent doublet, respectively. Each image is a z-projection of doublet of 9.6 nm long. The numbers of subtomogram in each class and their percentages are indicated. The arrowhead indicates PF B1. (D) Examples of incomplete B-tubule in procentriole tomogram from three classes. The incomplete B-tubules are marked by yellow arrowheads.
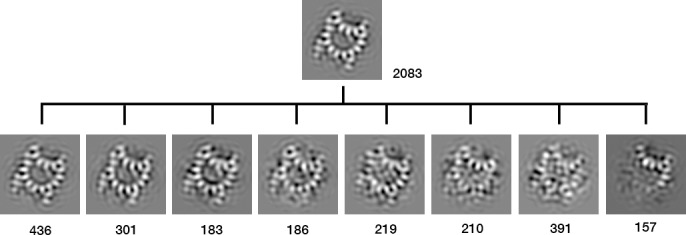
Figure 5—figure supplement 1. Classification and Identification of Partially Assembled B-tubule.


