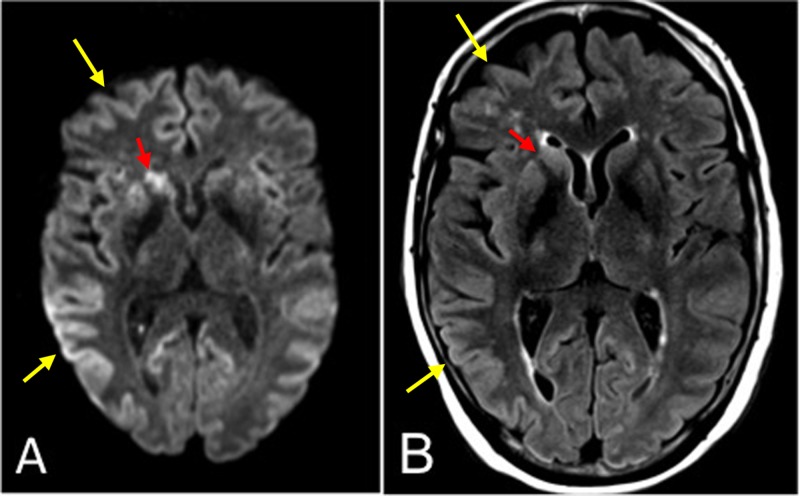
Figure 1. Axial magnetic resonance imaging (MRI) of Case 1.
(A) Diffusion-weighted image (DWI) at the level of the basal ganglia demonstrating asymmetrically increased signal in the entire neocortex (yellow arrows) and striatum (red arrows). (B) T2-weighted fluid attenuation inversion recovery (T2-FLAIR) image with less corresponding hyperintense signal.

