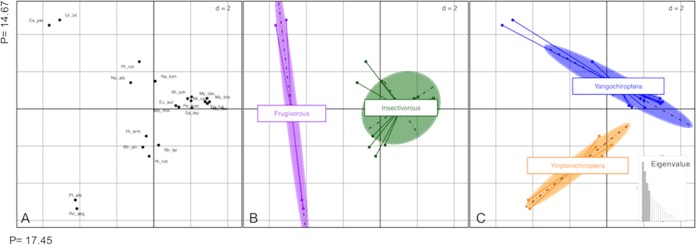
FIG 6.
Principal-coordinate analysis (PCoA) of bat NTCP highlights an effect of diet on NTCP evolution. PCoA was performed on the bat NTCP protein sequence alignment using the ADEGENET package in R (91). Only polymorphic sites were retained for the analysis. The pairwise distance between each sequence was calculated and then centered, and a planar representation of these distances was achieved by PCoA. The PCoA plots were generated using the first two principal coordinates (PCs), which explain a total of 33% of the variation. The graphics were obtained with the ADEGRAPHICS package available in R (92). The plot shows bat species grouping by similarities in polymorphic sites of the NTCP protein sequence. (A) Projection of species genetic distance, with each species label abbreviation. (B and C) A clear structure opposes frugivorous to insectivorous species on the first axis (B), while the second axis shows a tendency of phylogenetic groups opposing the Yinpterochiroptera to Yangochiroptera (C). Abbreviations: Ep_fus, Eptesicus fuscus; My_luc, Myotis lucifugus; My_dav, Myotis davidii; My_bra, Myotis brandtii; Mi_sch, Miniopterus schreibersii; Mi_nat, Miniopterus natalensis; Ur_bil, Uroderma bilobatum; Ca_per, Carollia perspicillata; Pt_rub, Pteronotus rubiginosus; Na_tum, Natalus tumidirostris; Mo_mol, Molossus molossus; Eu_aur, Eumops auripendulus; Pe_mac, Peropteryx macrotis; Sa_lep, Saccopteryx leptura; No_alb, Noctilio albiventris; Pt_ale, Pteropus alecto; Ro_aeg, Rousettus aegyptiacus; Rh_sin, Rhinolophus sinicus; Rh_fer, Rhinolophus ferrumequinum; Hi_arm, Hipposideros armiger; Hi_rub, Hipposideros ruber.

