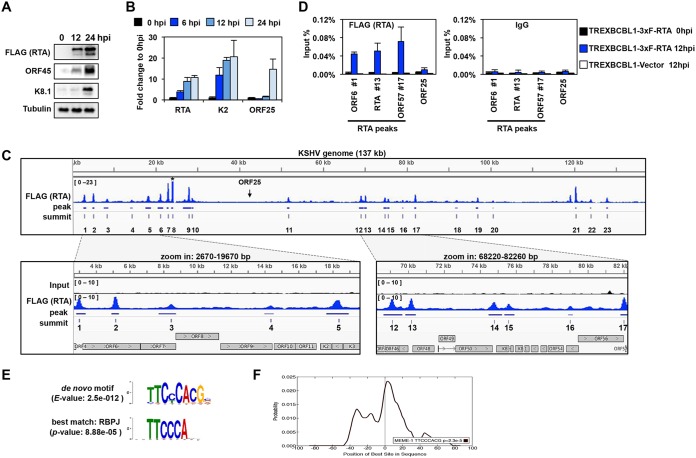
FIG 1.
Genome-wide mapping of the RTA-binding sites on the viral genome during KSHV lytic reactivation. (A) Immunoblot analysis of viral protein expression in TRExBCBL1-3×FLAG-RTA cells during latency (0 hpi), at 12 hpi, and 24 hpi. 3×FLAG-RTA was detected by anti-FLAG antibody. (B) RT-qPCR analysis of viral gene expression in TRExBCBL1-3×FLAG-RTA at the indicated time points. (C) Snapshot of RTA binding on the KSHV genome (1 to 137168 bp) (GenBank accession no. NC_009333.1) in TRExBCBL1-3×FLAG-RTA cells at 12 hpi, which was identified by RTA (FLAG) ChIP-seq (top graph). The terminal repeats were excluded. The bottom graphs are zoomed-in views of RTA binding and their corresponding inputs in the indicated KSHV genomic regions. The genomic coordinates of the 23 RTA peaks are listed in Table 1. Note that the peak 8 is out of range. The arrow indicates the location of ORF25. (D) RTA (using FLAG antibody) and IgG ChIP assays were performed at 0 hpi and 12 hpi by using TRExBCBL1-3×FLAG-RTA cells, followed by qPCR quantification of the immunoprecipitated DNA at the indicated RTA-binding sites. The ORF25 region and the TRExBCBL1-Vector cell line were used as negative controls. (E) MEME/TOMTOM analysis was applied to identify the most significantly enriched de novo motif within the 50-bp radius of the 23 RTA peak summits on the KSHV genome (top), which matched to the RBP-Jκ-binding motif (bottom). (F) CentriMo analysis of 100-bp radius of the RTA-binding summits shows that the probability of the RBP-Jκ-binding motif is the highest at the summit of the RTA binding.

