FIG 2.
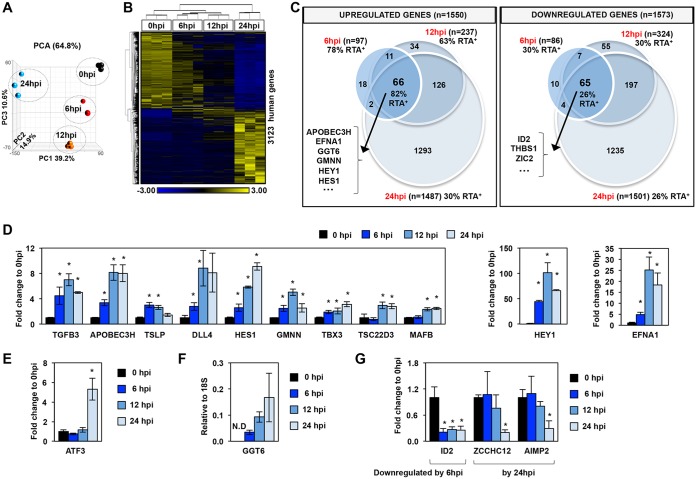
Global host gene expression changes in PEL cells upon KSHV reactivation. (A) Principal-component analysis (PCA) of the time course RNA-seq data. (B) Hierarchical clustering of 3,123 host genes, which were more than 2-fold differentially expressed (cutoff P value, FDR <0.05) during KSHV reactivation relative to latency (0 hpi). RPKM values are shifted to 0 and scaled to a standard deviation of 1. Blue and yellow represent lower-than-average and higher-than-average gene expression changes, respectively. (C) Venn diagram representation of the 3,123 host genes (described in panel B) showing the numbers of the significantly upregulated and downregulated host genes during KSHV reactivation relative to latency. The percentage of RTA target genes within each group is also shown, which is based on the RTA ChIP-seq data at 12 hpi. Some examples of genes from the middle intersections are shown. (D) Measuring the induction of host genes by RT-qPCR to confirm the RNA-seq results at the indicated time points during lytic reactivation. Significance test was performed between reactivated and latency samples. (E) Example for a host gene upregulated only at 24 hpi. (F) RT-qPCR confirmation of GGT6 induction during KSHV reactivation. GGT6 expression was calculated relative to the expression of 18S rRNA. N.D, not detectable. (G) Examples for genes that are downregulated during lytic reactivation. *, P < 0.05.

